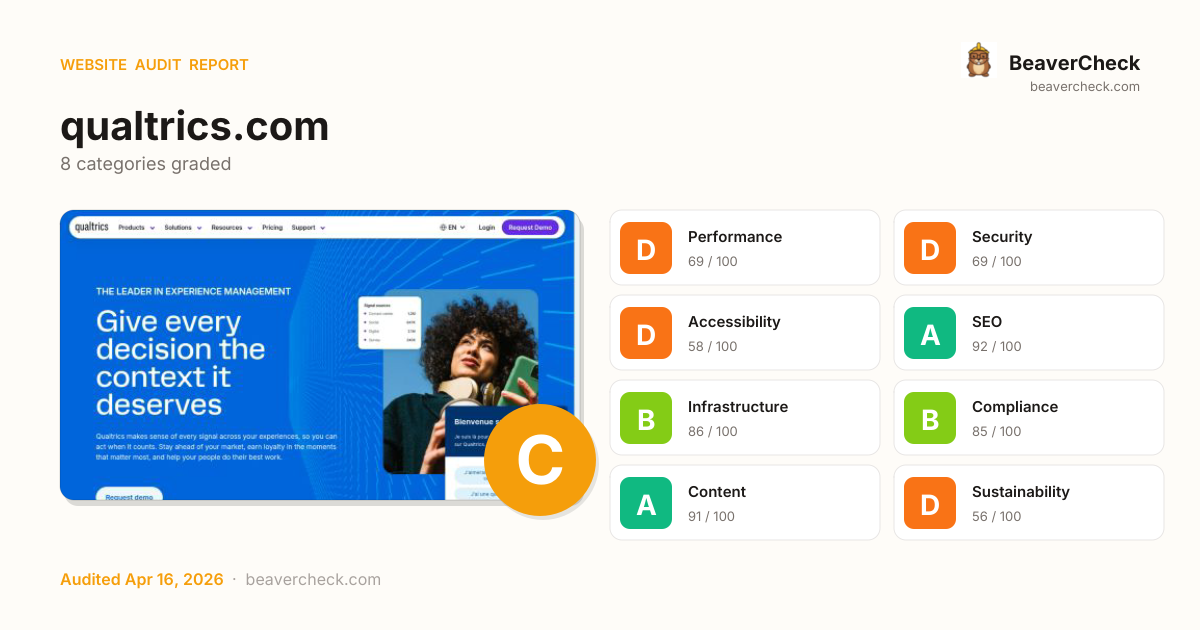
Mobile 375 × 812

Desktop 1440 × 900

Score: 73 / 100
Based on 8 categories, 0 sections
Room to improve — your 39.4s load time is above Google's 2.5s 'Good' threshold.
Several missing protections leave your users and data exposed.
Several issues make your site difficult for assistive technology users.
Well-optimized for search — your content is discoverable.
Solid infrastructure — fast server responses across the board.
Strong compliance posture across regulations.
Rich content metadata — your pages look great everywhere.
Heavier than average — reducing page weight saves energy and bandwidth.
The overall score is a weighted average of individual category scores. Categories with more impact on user experience and security carry more weight.
Weights reflect general web best practices. Individual needs may differ.
Content-Security-Policy header is missing
Security gaps expose your site and users to attacks, eroding trust.
No Content-Security-Policy header found
Security gaps expose your site and users to attacks, eroding trust.
Page weighs 19.6 MB (13.0 MB transferred)
Performance issues directly impact user engagement and conversion rates.
1 link(s) with no accessible text
Accessibility issues exclude users with disabilities — up to 15% of your potential audience.
165 third-party resources (100% of weight)
Performance issues directly impact user engagement and conversion rates.
High impact, low effort — start here.
High impact, requires investment.
Small gains, minimal effort.
Nothing in this quadrant — good news.
Low impact, high effort — do last.
Nothing in this quadrant — good news.
[](https://beavercheck.com/results/a5be3bd2-5187-4b53-8622-afbaf7c124c5)<a href="https://beavercheck.com/results/a5be3bd2-5187-4b53-8622-afbaf7c124c5"><img src="https://beavercheck.com/badge?url=https%3A%2F%2Fqualtrics.com" alt="BeaverCheck Score"></a>https://beavercheck.com/badge?url=https%3A%2F%2Fqualtrics.comThis badge auto-updates with your latest scan result.
Your site performs reasonably well, but a few targeted fixes could meaningfully improve results. Your LCP of 39.4s exceeds Google's 2.5s 'Good' threshold and the 2 performance issues below directly contribute to it. Accessibility issues exclude users who rely on assistive technology — an estimated 15% of your potential audience. Addressing the critical issues below would have the most immediate impact on your user trust.
6 barrier(s) likely increasing bounce by ~30%.
Page takes 39.4s to load
+12% bounceUsers abandon at ~3s — you're 36.9s over the 2.5s threshold
Fix: Optimize render-blocking resources, preload the hero image, and compress images
Page feels frozen for 1.4s
+5% bounceClicks on the primary CTA are ignored while JavaScript runs
Fix: Break up long tasks; defer non-critical JavaScript to post-hydration
No Content-Security-Policy header
+1% bounceHigher XSS blast radius — one compromised script can exfiltrate the checkout form
Fix: Ship a reporting-only CSP first, then enforce once violations are clean
Severe layout shift during page load
+6% bounceUsers mis-click when content jumps — converting intent into frustration
Fix: Reserve space for images, ads, and embeds with explicit width/height
Content is hard to read
+2% bounceGraduate-level reading difficulty — limits the addressable audience for product or blog pages
Fix: Shorten sentences; replace jargon with plain language; target Flesch ease ≥60
15 link(s) with generic text ("click here", "read more")
+1% bounceScreen-reader users navigating by link list see no context — and search engines can't infer relevance
Fix: Rewrite with descriptive phrases that identify the destination
Preliminary CRO audit — each barrier links to the tab with detailed analysis.
$650 investment → $3.28/month returns + USD 157,500 risk avoided
$650
6h · 5 findings
$3.28 /mo
~$39 / year
USD 157,500
if kept compliant
$100 — in quick wins — start here for the fastest payback
Figures combine localized regulatory fine ceilings, search/conversion value priced against local CPC, and bandwidth waste estimates. Results depend on implementation quality and audience composition. Not legal or financial advice.
6.5 developer hours at $100/hr
Based on United States rates ($100/hr)
Start here for the best return on investment
$13,128 / month at risk
~$157,539 / year if left unfixed
$157,500
+8 more
$3.28 /mo
40986.4 MB/mo × 0.080 USD/GB
Compliance figures represent the statutory maximum fine for the most severe triggered category, capped per regulation — not the sum of per-finding penalties. Based on published regulatory fine ranges. This is not legal advice.
Unique monthly visitors from your analytics
Purchases, signups, or key actions
Optional — for revenue estimation
more engaged visitors from reduced bounce
Fix 4 critical issues to capture this value
Based on Google/Deloitte research ("Milliseconds Make Millions") showing a ~7% bounce rate increase per additional second of LCP above the 2.5s "Good" threshold.
Your site's LCP: → estimated after fixes.
These are estimates based on industry research — actual results vary
Your data stays in your browser — nothing is sent to our servers
Thanks for your feedback!
We'll use a cached audit if available, or offer to scan.
Industry-standard audits powered by Google Lighthouse.
Key metrics that affect user experience.
First Contentful Paint First Contentful Paint — how long until the browser renders the first piece of content. Under 1.8s is good.
9.24 s
Largest Contentful Paint Largest Contentful Paint — how long until the largest visible element loads. Under 2.5s is good.
39.42 s
Total Blocking Time Total Blocking Time — total time the main thread was blocked, preventing user input. Under 200ms is good.
1.45 s
Cumulative Layout Shift Cumulative Layout Shift — measures visual stability. How much the page layout shifts during loading. Under 0.1 is good.
0.652
Speed Index Speed Index — how quickly content is visually displayed during load. Under 3.4s is good.
9.82 s
Time to Interactive Time to Interactive — how long until the page is fully interactive and responds to user input. Under 3.8s is good.
40.97 s
Audit breakdown by category with detailed findings.
Remove large, duplicate JavaScript modules from bundles to reduce unnecessary bytes consumed by network activity.
Performance issues directly impact user engagement and conversion rates.
Polyfills and transforms enable older browsers to use new JavaScript features. However, many aren't necessary for modern browsers. Consider modifying your JavaScript build process to not transpile Baseline features, unless you know you must support older browsers. Learn why most sites can deploy ES6+ code without transpiling
Shipping ES5 transpiled code to modern browsers wastes bytes — every user with an evergreen browser pays for compatibility you don't need.
Most users today run browsers that natively support ES6+, async/await, optional chaining, and the rest of modern JavaScript. Transpiling to ES5 'just in case' adds 20-40% to your bundle for no benefit. Configure your build to target a modern browserslist, or ship a differential bundle pair (modern + legacy) with the module/nomodule pattern.
Source: Google web.dev / Lighthouse
3rd party code can significantly impact load performance. Reduce and defer loading of 3rd party code to prioritize your page's content.
Performance issues directly impact user engagement and conversion rates.
A long cache lifetime can speed up repeat visits to your page. Learn more about caching.
Performance issues directly impact user engagement and conversion rates.
Layout shifts occur when elements move absent any user interaction. Investigate the causes of layout shifts, such as elements being added, removed, or their fonts changing as the page loads.
Performance issues directly impact user engagement and conversion rates.
Your first network request is the most important. Reduce its latency by avoiding redirects, ensuring a fast server response, and enabling text compression.
Performance issues directly impact user engagement and conversion rates.
A forced reflow occurs when JavaScript queries geometric properties (such as offsetWidth) after styles have been invalidated by a change to the DOM state. This can result in poor performance. Learn more about forced reflows and possible mitigations.
Performance issues directly impact user engagement and conversion rates.
Each subpart has specific improvement strategies. Ideally, most of the LCP time should be spent on loading the resources, not within delays.
Performance issues directly impact user engagement and conversion rates.
Optimize LCP by making the LCP image discoverable from the HTML immediately, and avoiding lazy-loading
Performance issues directly impact user engagement and conversion rates.
Avoid chaining critical requests by reducing the length of chains, reducing the download size of resources, or deferring the download of unnecessary resources to improve page load.
Performance issues directly impact user engagement and conversion rates.
Requests are blocking the page's initial render, which may delay LCP. Deferring or inlining can move these network requests out of the critical path.
Performance issues directly impact user engagement and conversion rates.
Reducing the download time of images can improve the perceived load time of the page and LCP. Learn more about optimizing image size
Performance issues directly impact user engagement and conversion rates.
| URL | Resource Size | Est Savings | |
|---|---|---|---|
17.3%
YOY enrollment increase
95%
satisfaction increase
“Qualtrics helped u… div.!overflow-visible > div#swiper-wrapper-5155517741f87c94 > div.swiper-slide > div.social-proof-card | www.qualtrics.com/sites/default/files/2026-03/stanford.png | 2.3 MiB | 2.1 MiB |
50%
lower costs vs traditional research
98%
faster time to insights
“Synthe… div.!overflow-visible > div#swiper-wrapper-5155517741f87c94 > div.swiper-slide > div.social-proof-card | www.qualtrics.com/sites/default/files/2026-03/image-placeholder_0.png | 1.1 MiB | 976.4 KiB |
30%
increase in likelihood to recommend
17%
increase in Shack locations
“Th… div.!overflow-visible > div#swiper-wrapper-5155517741f87c94 > div.swiper-slide > div.social-proof-card | www.qualtrics.com/sites/default/files/2026-03/shake-shack.png | 1.0 MiB | 941.9 KiB |
17
connected programs
10K+
automatic follow-up actions
“We’ve elevated our … div.!overflow-visible > div#swiper-wrapper-5155517741f87c94 > div.swiper-slide > div.social-proof-card | www.qualtrics.com/sites/default/files/2026-03/servicenow-l-1.png | 1009.3 KiB | 917.1 KiB |
2X
ARR growth
30%
fewer support tickets
“When a fleet manager tells us abou… div.!overflow-visible > div#swiper-wrapper-5155517741f87c94 > div.swiper-slide > div.social-proof-card | www.qualtrics.com/sites/default/files/2026-03/samsara.jpg | 569.1 KiB | 134.5 KiB |
リサーチハブウィジェット article.media > div.field__item > picture > img | /sites/default/files/styles/standard_small_retina/public/... | 146.6 KiB | 131.9 KiB |
Customer journeys displayed by graphs. article.media > div.field__item > picture > img | /sites/default/files/styles/standard_small_retina/public/... | 112.1 KiB | 103.2 KiB |
test article.media > div.field__item > picture > img | /sites/default/files/styles/standard_small_retina/public/... | 43.1 KiB | 38.8 KiB |
These insights are also available in the Chrome DevTools Performance Panel - record a trace to view more detailed information.
Time to Interactive is the amount of time it takes for the page to become fully interactive. Learn more about the Time to Interactive metric.
Performance issues directly impact user engagement and conversion rates.
Redirects introduce additional delays before the page can be loaded. Learn how to avoid page redirects.
Performance issues directly impact user engagement and conversion rates.
| URL | Time Spent |
|---|---|
| qualtrics.com/ | 1.1 s |
| www.qualtrics.com/ | 0.0 ms |
These are the largest layout shifts observed on the page. Each table item represents a single layout shift, and shows the element that shifted the most. Below each item are possible root causes that led to the layout shift. Some of these layout shifts may not be included in the CLS metric value due to windowing. Learn how to improve CLS
Performance issues directly impact user engagement and conversion rates.
| Element | Layout shift score |
|---|---|
| 0.480 | |
This site uses cookies and related technologies, as described in our privacy st… body.path-frontpage > div#onetrust-consent-sdk > div#onetrust-banner-sdk | 0.168 |
Indiana University Online div.social-proof-card__inner > div.social-proof-card__inner-content > div.social-proof-card__quote-logo > img | 0.004 |
The maximum potential First Input Delay that your users could experience is the duration of the longest task. Learn more about the Maximum Potential First Input Delay metric.
Performance issues directly impact user engagement and conversion rates.
Reduce unused rules from stylesheets and defer CSS not used for above-the-fold content to decrease bytes consumed by network activity. Learn how to reduce unused CSS.
Performance issues directly impact user engagement and conversion rates.
| URL | Transfer Size | Est Savings |
|---|---|---|
| /sites/default/files/css/css_aClAeDH7865k4Ewesb_aKdbuV9ts... | 99.4 KiB | 92.4 KiB |
| 21.0 KiB | 18.8 KiB |
Reduce unused JavaScript and defer loading scripts until they are required to decrease bytes consumed by network activity. Learn how to reduce unused JavaScript.
Multi-megabyte JavaScript bundles delay every interactive feature on the page.
This is the Lighthouse audit fired when too much JS is shipped relative to what executes. The fix isn't a config flag — it requires bundle analysis (webpack-bundle-analyzer, rollup-plugin-visualizer), splitting routes into chunks, lazy-loading off-screen components, and removing unused dependencies. Fundamentally different from minification: minifying reduces byte count, this reduces what's downloaded at all.
Source: Google web.dev / Lighthouse
| URL | Transfer Size | Est Savings |
|---|---|---|
| www.googletagmanager.com/gtag/js?id=G-Z0RM4JK167&cx=c>m=4e64f0 | 170.0 KiB | 67.9 KiB |
| www.googletagmanager.com/gtag/js?id=UA-570722-11&cx=c>m=4e64f0 | 115.6 KiB | 62.6 KiB |
| cdn.cookielaw.org/scripttemplates/202409.1.0/otBannerSdk.js | 111.2 KiB | 59.9 KiB |
| js.qualified.com/qualified.js?token=22aJYj3rCPvhtfbj | 115.8 KiB | 57.3 KiB |
| www.googletagmanager.com/gtm.js?id=GTM-W6F8HX | 203.9 KiB | 56.7 KiB |
| js.qualified.com/packs/js/multimodal_v2-f8a905b1.js | 93.6 KiB | 47.9 KiB |
| /themes/custom/arcadia/src/node_modules/swiper/swiper-bun... | 42.1 KiB | 26.1 KiB |
| /sites/default/files/js/js_bLq8iO2Klhh6uQm2xekP1LO-PZ6Vut... | 37.2 KiB | 24.7 KiB |
Consider reducing the time spent parsing, compiling, and executing JS. You may find delivering smaller JS payloads helps with this. Learn how to reduce Javascript execution time.
Performance issues directly impact user engagement and conversion rates.
Consider reducing the time spent parsing, compiling and executing JS. You may find delivering smaller JS payloads helps with this. Learn how to minimize main-thread work
Performance issues directly impact user engagement and conversion rates.
| Category | Time Spent |
|---|---|
| Other | 3.8 s |
| Script Evaluation | 2.9 s |
| Style & Layout | 2.7 s |
| Rendering | 732 ms |
| Script Parsing & Compilation | 332 ms |
| Parse HTML & CSS | 157 ms |
| Garbage Collection | 74 ms |
Many navigations are performed by going back to a previous page, or forwards again. The back/forward cache (bfcache) can speed up these return navigations. Learn more about the bfcache
Performance issues directly impact user engagement and conversion rates.
| Failure reason | Failure type |
|---|---|
| Pages with WebSocket cannot enter back/forward cache. | Pending browser support |
Large network payloads cost users real money and are highly correlated with long load times. Learn how to reduce payload sizes.
Performance issues directly impact user engagement and conversion rates.
Set an explicit width and height on image elements to reduce layout shifts and improve CLS. Learn how to set image dimensions
Performance issues directly impact user engagement and conversion rates.
| URL | |
|---|---|
Star div.field__item > article.media > div.field__item > img | www.qualtrics.com/sites/default/files/2026-03/icons_2.svg |
Gabb div.social-proof-card__inner > div.social-proof-card__inner-content > div.social-proof-card__quote-logo > img | www.qualtrics.com/sites/default/files/2025-11/gabb-black.svg |
ServiceNow div.social-proof-card__inner > div.social-proof-card__inner-content > div.social-proof-card__quote-logo > img | www.qualtrics.com/sites/default/files/2025-10/servicenow-logo-%281%29_2.svg |
Samsara div.social-proof-card__inner > div.social-proof-card__inner-content > div.social-proof-card__quote-logo > img | www.qualtrics.com/sites/default/files/2025-12/samsara-logo-500x281.svg |
Shake Shack div.social-proof-card__inner > div.social-proof-card__inner-content > div.social-proof-card__quote-logo > img | www.qualtrics.com/sites/default/files/2025-01/shake-shack-%281%29_0.svg |
Indiana University Online div.social-proof-card__inner > div.social-proof-card__inner-content > div.social-proof-card__quote-logo > img | www.qualtrics.com/sites/default/files/2025-03/iuo_1.svg |
More information about the performance of your application. These numbers don't directly affect the Performance score.
These checks highlight opportunities to improve the accessibility of your web app. Automatic detection can only detect a subset of issues and does not guarantee the accessibility of your web app, so manual testing is also encouraged.
Using ARIA attributes in roles where they are prohibited can mean that important information is not communicated to users of assistive technologies. Learn more about prohibited ARIA roles.
Performance issues directly impact user engagement and conversion rates.
| Failing Elements |
|---|
AI assistant body.path-frontpage > q-focus-sentinel > div |
After AI assistant body.path-frontpage > q-focus-sentinel > div |
AI assistant, start div#qualified-multimodal-host > div |
AI assistant, end div#qualified-multimodal-host > div |
These are opportunities to improve the usage of ARIA in your application which may enhance the experience for users of assistive technology, like a screen reader.
Low-contrast text is difficult or impossible for many users to read. Learn how to provide sufficient color contrast.
Performance issues directly impact user engagement and conversion rates.
| Failing Elements |
|---|
Feedback div.QSIFeedbackButton > button#QSIFeedbackButton-btn > div > div |
These are opportunities to improve the legibility of your content.
Properly ordered headings that do not skip levels convey the semantic structure of the page, making it easier to navigate and understand when using assistive technologies. Learn more about heading order.
Performance issues directly impact user engagement and conversion rates.
| Failing Elements |
|---|
In a branch or online, give customers what they need—before they have to ask. div#tab-panel-83711 > div.tab-module-item__content > div.tab-module-item__headline > h4.headline--h4 |
These are opportunities to improve keyboard navigation in your application.
Errors logged to the console indicate unresolved problems. They can come from network request failures and other browser concerns. Learn more about this errors in console diagnostic audit
Performance issues directly impact user engagement and conversion rates.
| Source | Description |
|---|---|
Access to XMLHttpRequest at 'https://secure.adnxs.com/getuidj' from origin 'https://www.qualtrics.com' has been blocked by CORS policy: No 'Access-Control-Allow-Origin' header is present on the requested resource. | |
Failed to load resource: net::ERR_FAILED |
These checks ensure that your page is following basic search engine optimization advice. There are many additional factors Lighthouse does not score here that may affect your search ranking, including performance on Core Web Vitals. Learn more about Google Search Essentials.
Meta descriptions may be included in search results to concisely summarize page content. Learn more about the meta description.
Performance issues directly impact user engagement and conversion rates.
Descriptive link text helps search engines understand your content. Learn how to make links more accessible.
Performance issues directly impact user engagement and conversion rates.
| Link destination | Link Text |
|---|---|
| www.qualtrics.com/market-research/ | Learn more |
| www.qualtrics.com/market-research/research/ | Learn more |
| www.qualtrics.com/market-research/product-research/ | Learn more |
| www.qualtrics.com/customer-experience/ | Learn more |
| www.qualtrics.com/customer-experience/locations/ | Learn more |
| www.qualtrics.com/customer-experience/voice-of-customer/ | Learn more |
| www.qualtrics.com/customer-experience/ | Learn more |
| www.qualtrics.com/employee-experience/ | Learn more |
| www.qualtrics.com/xm-institute/ | Learn more |
| www.qualtrics.com/platform/security/ | Learn more |
| www.qualtrics.com/industries/financial-services/ | Learn more |
| www.qualtrics.com/industries/financial-services/ | Learn more |
| www.qualtrics.com/industries/financial-services/ | Learn more |
| www.qualtrics.com/industries/financial-services/ | Learn more |
| cookiepedia.co.uk/giving-consent-to-cookies | More information |
Format your HTML in a way that enables crawlers to better understand your app’s content.
Industry-standard audits powered by Google Lighthouse. — Desktop
Key metrics that affect user experience. — Desktop
First Contentful Paint First Contentful Paint — how long until the browser renders the first piece of content. Under 1.8s is good.
1.57 s
Largest Contentful Paint Largest Contentful Paint — how long until the largest visible element loads. Under 2.5s is good.
2.29 s
Total Blocking Time Total Blocking Time — total time the main thread was blocked, preventing user input. Under 200ms is good.
4 ms
Cumulative Layout Shift Cumulative Layout Shift — measures visual stability. How much the page layout shifts during loading. Under 0.1 is good.
0.129
Speed Index Speed Index — how quickly content is visually displayed during load. Under 3.4s is good.
1.65 s
Time to Interactive Time to Interactive — how long until the page is fully interactive and responds to user input. Under 3.8s is good.
3.01 s
Audit breakdown by category with detailed findings.
Remove large, duplicate JavaScript modules from bundles to reduce unnecessary bytes consumed by network activity.
Performance issues directly impact user engagement and conversion rates.
Polyfills and transforms enable older browsers to use new JavaScript features. However, many aren't necessary for modern browsers. Consider modifying your JavaScript build process to not transpile Baseline features, unless you know you must support older browsers. Learn why most sites can deploy ES6+ code without transpiling
Shipping ES5 transpiled code to modern browsers wastes bytes — every user with an evergreen browser pays for compatibility you don't need.
Most users today run browsers that natively support ES6+, async/await, optional chaining, and the rest of modern JavaScript. Transpiling to ES5 'just in case' adds 20-40% to your bundle for no benefit. Configure your build to target a modern browserslist, or ship a differential bundle pair (modern + legacy) with the module/nomodule pattern.
Source: Google web.dev / Lighthouse
3rd party code can significantly impact load performance. Reduce and defer loading of 3rd party code to prioritize your page's content.
Performance issues directly impact user engagement and conversion rates.
Layout shifts occur when elements move absent any user interaction. Investigate the causes of layout shifts, such as elements being added, removed, or their fonts changing as the page loads.
Performance issues directly impact user engagement and conversion rates.
Your first network request is the most important. Reduce its latency by avoiding redirects, ensuring a fast server response, and enabling text compression.
Performance issues directly impact user engagement and conversion rates.
A forced reflow occurs when JavaScript queries geometric properties (such as offsetWidth) after styles have been invalidated by a change to the DOM state. This can result in poor performance. Learn more about forced reflows and possible mitigations.
Performance issues directly impact user engagement and conversion rates.
Reducing the download time of images can improve the perceived load time of the page and LCP. Learn more about optimizing image size
Performance issues directly impact user engagement and conversion rates.
| URL | Resource Size | Est Savings | |
|---|---|---|---|
17.3%
YOY enrollment increase
95%
satisfaction increase
“Qualtrics helped u… div.!overflow-visible > div#swiper-wrapper-47452dd9b7d15c35 > div.swiper-slide > div.social-proof-card | www.qualtrics.com/sites/default/files/2026-03/stanford.png | 2.3 MiB | 2.1 MiB |
50%
lower costs vs traditional research
98%
faster time to insights
“Synthe… div.!overflow-visible > div#swiper-wrapper-47452dd9b7d15c35 > div.swiper-slide > div.social-proof-card | www.qualtrics.com/sites/default/files/2026-03/image-placeholder_0.png | 1.1 MiB | 976.4 KiB |
30%
increase in likelihood to recommend
17%
increase in Shack locations
“Th… div.!overflow-visible > div#swiper-wrapper-47452dd9b7d15c35 > div.swiper-slide > div.social-proof-card | www.qualtrics.com/sites/default/files/2026-03/shake-shack.png | 1.0 MiB | 941.9 KiB |
17
connected programs
10K+
automatic follow-up actions
“We’ve elevated our … div.!overflow-visible > div#swiper-wrapper-47452dd9b7d15c35 > div.swiper-slide > div.social-proof-card | www.qualtrics.com/sites/default/files/2026-03/servicenow-l-1.png | 1009.3 KiB | 917.1 KiB |
リサーチハブウィジェット article.media > div.field__item > picture > img | /sites/default/files/styles/standard_xl/public/2026-03/ou... | 196.4 KiB | 160.0 KiB |
2X
ARR growth
30%
fewer support tickets
“When a fleet manager tells us abou… div.!overflow-visible > div#swiper-wrapper-47452dd9b7d15c35 > div.swiper-slide > div.social-proof-card | www.qualtrics.com/sites/default/files/2026-03/samsara.jpg | 569.1 KiB | 134.5 KiB |
Customer journeys displayed by graphs. article.media > div.field__item > picture > img | /sites/default/files/styles/standard_xl/public/2026-03/ho... | 112.1 KiB | 93.0 KiB |
drive action article.media > div.field__item > picture > img | /sites/default/files/styles/standard_xl/public/2026-03/ho... | 65.2 KiB | 53.1 KiB |
test article.media > div.field__item > picture > img | /sites/default/files/styles/standard_xl/public/2026-03/2.... | 44.4 KiB | 36.2 KiB |
Optimize LCP by making the LCP image discoverable from the HTML immediately, and avoiding lazy-loading
Performance issues directly impact user engagement and conversion rates.
Avoid chaining critical requests by reducing the length of chains, reducing the download size of resources, or deferring the download of unnecessary resources to improve page load.
Performance issues directly impact user engagement and conversion rates.
Requests are blocking the page's initial render, which may delay LCP. Deferring or inlining can move these network requests out of the critical path.
Performance issues directly impact user engagement and conversion rates.
A long cache lifetime can speed up repeat visits to your page. Learn more about caching.
Performance issues directly impact user engagement and conversion rates.
| Request | Cache TTL | Transfer Size |
|---|---|---|
| assets.qualified.com/static-media/piperx-loading/Ruby.mp4 | 0.0 ms | 2.6 MiB |
| assets.qualified.com/packs/media/Inter-roman.var.b2129c00.woff2 | 0.0 ms | 222.3 KiB |
| js.qualified.com/qualified.js?token=22aJYj3rCPvhtfbj | 60.0 s | 116.4 KiB |
| assets.qualified.com/packs/media/Inter-SemiBold.fcb100c7.woff2 | 0.0 ms | 103.6 KiB |
| assets.qualified.com/packs/media/Inter-Regular.f1f0c35b.woff2 | 0.0 ms | 97.2 KiB |
| www.google-analytics.com/analytics.js | 7200.0 s | 20.9 KiB |
| /beacon.min.js/v8c78df7c7c0f484497ecbca7046644da177152312... | 86400.0 s | 10.7 KiB |
| /p.css?s=1&k=igb0ftr&ht=tk&f=30546.30551.30552.30553.3055... | 604800.0 s | 172 B |
These insights are also available in the Chrome DevTools Performance Panel - record a trace to view more detailed information.
Redirects introduce additional delays before the page can be loaded. Learn how to avoid page redirects.
Performance issues directly impact user engagement and conversion rates.
| URL | Time Spent |
|---|---|
| qualtrics.com/ | 521 ms |
| www.qualtrics.com/ | 0.0 ms |
These are the largest layout shifts observed on the page. Each table item represents a single layout shift, and shows the element that shifted the most. Below each item are possible root causes that led to the layout shift. Some of these layout shifts may not be included in the CLS metric value due to windowing. Learn how to improve CLS
Performance issues directly impact user engagement and conversion rates.
| Element | Layout shift score |
|---|---|
Products
Solutions
Resources
Pricing
Support
EN
Login
Request Demo body.path-frontpage > div.dialog-off-canvas-main-canvas > header.z-[51] | 0.128 |
THE LEADER IN EXPERIENCE MANAGEMENT
Give every decision the context it deserves… body.path-frontpage > div.dialog-off-canvas-main-canvas > main.relative | 0.083 |
Trusted by leading brands div.dialog-off-canvas-main-canvas > main.relative > article.node > section.mt-0 | 0.028 |
Agentic AI div.featured-accordion-v2__image-column > div.featured-accordion-v2__image-panel > div.featured-accordion-v2__image-panel-item > img | 0.001 |
Time to Interactive is the amount of time it takes for the page to become fully interactive. Learn more about the Time to Interactive metric.
Performance issues directly impact user engagement and conversion rates.
Reduce unused rules from stylesheets and defer CSS not used for above-the-fold content to decrease bytes consumed by network activity. Learn how to reduce unused CSS.
Performance issues directly impact user engagement and conversion rates.
| URL | Transfer Size | Est Savings |
|---|---|---|
| /sites/default/files/css/css_aClAeDH7865k4Ewesb_aKdbuV9ts... | 99.4 KiB | 91.3 KiB |
Reduce unused JavaScript and defer loading scripts until they are required to decrease bytes consumed by network activity. Learn how to reduce unused JavaScript.
Multi-megabyte JavaScript bundles delay every interactive feature on the page.
This is the Lighthouse audit fired when too much JS is shipped relative to what executes. The fix isn't a config flag — it requires bundle analysis (webpack-bundle-analyzer, rollup-plugin-visualizer), splitting routes into chunks, lazy-loading off-screen components, and removing unused dependencies. Fundamentally different from minification: minifying reduces byte count, this reduces what's downloaded at all.
Source: Google web.dev / Lighthouse
| URL | Transfer Size | Est Savings |
|---|---|---|
| www.googletagmanager.com/gtag/js?id=G-Z0RM4JK167&cx=c>m=4e64f0&bs=ctrl2 | 170.0 KiB | 68.5 KiB |
| www.googletagmanager.com/gtag/js?id=UA-570722-11&cx=c>m=4e64f0&bs=ctrl2 | 115.6 KiB | 64.4 KiB |
| www.googletagmanager.com/gtm.js?id=GTM-W6F8HX | 203.9 KiB | 58.3 KiB |
| js.qualified.com/qualified.js?token=22aJYj3rCPvhtfbj | 115.8 KiB | 57.1 KiB |
| js.qualified.com/packs/js/multimodal_v2-f8a905b1.js | 93.6 KiB | 47.9 KiB |
| /themes/custom/arcadia/src/node_modules/swiper/swiper-bun... | 42.1 KiB | 26.1 KiB |
| /sites/default/files/js/js_bLq8iO2Klhh6uQm2xekP1LO-PZ6Vut... | 37.2 KiB | 24.7 KiB |
Many navigations are performed by going back to a previous page, or forwards again. The back/forward cache (bfcache) can speed up these return navigations. Learn more about the bfcache
Performance issues directly impact user engagement and conversion rates.
| Failure reason | Failure type |
|---|---|
| Pages with WebSocket cannot enter back/forward cache. | Pending browser support |
Large network payloads cost users real money and are highly correlated with long load times. Learn how to reduce payload sizes.
Performance issues directly impact user engagement and conversion rates.
Consider reducing the time spent parsing, compiling and executing JS. You may find delivering smaller JS payloads helps with this. Learn how to minimize main-thread work
Performance issues directly impact user engagement and conversion rates.
| Category | Time Spent |
|---|---|
| Other | 984 ms |
| Style & Layout | 616 ms |
| Script Evaluation | 549 ms |
| Rendering | 231 ms |
| Script Parsing & Compilation | 76 ms |
| Parse HTML & CSS | 42 ms |
| Garbage Collection | 5.4 ms |
Set an explicit width and height on image elements to reduce layout shifts and improve CLS. Learn how to set image dimensions
Performance issues directly impact user engagement and conversion rates.
| URL | |
|---|---|
Star div.field__item > article.media > div.field__item > img | www.qualtrics.com/sites/default/files/2026-03/icons_2.svg |
Indiana University Online Logo div.slider-handle-v8 > div.swiper-pagination-bullet > span.company-logo-container > img.company-logo | www.qualtrics.com/sites/default/files/2025-07/iuo-white_0.svg |
Gabb div.social-proof-card__inner > div.social-proof-card__inner-content > div.social-proof-card__quote-logo > img | www.qualtrics.com/sites/default/files/2025-11/gabb-black.svg |
Gabb Logo div.slider-handle-v8 > div.swiper-pagination-bullet > span.company-logo-container > img.company-logo | www.qualtrics.com/sites/default/files/2025-11/gabb-logo-white.svg |
ServiceNow div.social-proof-card__inner > div.social-proof-card__inner-content > div.social-proof-card__quote-logo > img | www.qualtrics.com/sites/default/files/2025-10/servicenow-logo-%281%29_2.svg |
Samsara div.social-proof-card__inner > div.social-proof-card__inner-content > div.social-proof-card__quote-logo > img | www.qualtrics.com/sites/default/files/2025-12/samsara-logo-500x281.svg |
Samsara Logo div.slider-handle-v8 > div.swiper-pagination-bullet > span.company-logo-container > img.company-logo | www.qualtrics.com/sites/default/files/2025-12/samsara-logo-whitesvg.svg |
Shake Shack div.social-proof-card__inner > div.social-proof-card__inner-content > div.social-proof-card__quote-logo > img | www.qualtrics.com/sites/default/files/2025-01/shake-shack-%281%29_0.svg |
Shake Shack Logo div.slider-handle-v8 > div.swiper-pagination-bullet > span.company-logo-container > img.company-logo | www.qualtrics.com/sites/default/files/2025-02/shake-shack-white.svg |
Indiana University Online div.social-proof-card__inner > div.social-proof-card__inner-content > div.social-proof-card__quote-logo > img | www.qualtrics.com/sites/default/files/2025-03/iuo_1.svg |
ServiceNow Logo div.slider-handle-v8 > div.swiper-pagination-bullet > span.company-logo-container > img.company-logo | www.qualtrics.com/sites/default/files/2025-02/servicenow-logo-white.svg |
More information about the performance of your application. These numbers don't directly affect the Performance score.
These checks highlight opportunities to improve the accessibility of your web app. Automatic detection can only detect a subset of issues and does not guarantee the accessibility of your web app, so manual testing is also encouraged.
Each ARIA `role` supports a specific subset of `aria-*` attributes. Mismatching these invalidates the `aria-*` attributes. Learn how to match ARIA attributes to their roles.
Performance issues directly impact user engagement and conversion rates.
| Failing Elements |
|---|
Retail div.tab-module__left > nav.tab-module__nav > div > button#tab-title-83711 |
Travel & hospitality div.tab-module__left > nav.tab-module__nav > div > button#tab-title-83716 |
Healthcare div.tab-module__left > nav.tab-module__nav > div > button#tab-title-83721 |
Financial services div.tab-module__left > nav.tab-module__nav > div > button#tab-title-83726 |
Some ARIA parent roles must contain specific child roles to perform their intended accessibility functions. Learn more about roles and required children elements.
Performance issues directly impact user engagement and conversion rates.
| Failing Elements |
|---|
Retail
Travel & hospitality
Healthcare
Financial services div.tab-module > div.tab-module__inner > div.tab-module__left > nav.tab-module__nav |
Using ARIA attributes in roles where they are prohibited can mean that important information is not communicated to users of assistive technologies. Learn more about prohibited ARIA roles.
Performance issues directly impact user engagement and conversion rates.
| Failing Elements |
|---|
AI assistant body.path-frontpage > q-focus-sentinel > div |
After AI assistant body.path-frontpage > q-focus-sentinel > div |
AI assistant, start div#qualified-multimodal-host > div |
AI assistant, end div#qualified-multimodal-host > div |
These are opportunities to improve the usage of ARIA in your application which may enhance the experience for users of assistive technology, like a screen reader.
Properly ordered headings that do not skip levels convey the semantic structure of the page, making it easier to navigate and understand when using assistive technologies. Learn more about heading order.
Performance issues directly impact user engagement and conversion rates.
| Failing Elements |
|---|
In a branch or online, give customers what they need—before they have to ask. div#tab-panel-83711 > div.tab-module-item__content > div.tab-module-item__headline > h4.headline--h4 |
These are opportunities to improve keyboard navigation in your application.
Errors logged to the console indicate unresolved problems. They can come from network request failures and other browser concerns. Learn more about this errors in console diagnostic audit
Performance issues directly impact user engagement and conversion rates.
| Description |
|---|
ReferenceError: ytag is not defined
at <anonymous>:1:1
at https://www.googletagmanager.com/gtm.js?id=GTM-W6F8HX:1085:429
at qR (https://www.googletagmanager.com/gtm.js?id=GTM-W6F8HX:1087:31)
at Md.pR (https://www.googletagmanager.com/gtm.js?id=GTM-W6F8HX:1084:92)
at Md.<anonymous> (https://www.googletagmanager.com/gtm.js?id=GTM-W6F8HX:495:187)
at k.apply (https://www.googletagmanager.com/gtm.js?id=GTM-W6F8HX:421:466)
at fb (https://www.googletagmanager.com/gtm.js?id=GTM-W6F8HX:384:719)
at eb (https://www.googletagmanager.com/gtm.js?id=GTM-W6F8HX:384:470)
at Md.<anonymous> (https://www.googletagmanager.com/gtm.js?id=GTM-W6F8HX:445:473)
at k.apply (https://www.googletagmanager.com/gtm.js?id=GTM-W6F8HX:421:466) |
These checks ensure that your page is following basic search engine optimization advice. There are many additional factors Lighthouse does not score here that may affect your search ranking, including performance on Core Web Vitals. Learn more about Google Search Essentials.
Meta descriptions may be included in search results to concisely summarize page content. Learn more about the meta description.
Performance issues directly impact user engagement and conversion rates.
Descriptive link text helps search engines understand your content. Learn how to make links more accessible.
Performance issues directly impact user engagement and conversion rates.
| Link destination | Link Text |
|---|---|
| www.qualtrics.com/market-research/ | Learn more |
| www.qualtrics.com/market-research/research/ | Learn more |
| www.qualtrics.com/market-research/product-research/ | Learn more |
| www.qualtrics.com/customer-experience/ | Learn more |
| www.qualtrics.com/customer-experience/locations/ | Learn more |
| www.qualtrics.com/customer-experience/voice-of-customer/ | Learn more |
| www.qualtrics.com/customer-experience/ | Learn more |
| www.qualtrics.com/employee-experience/ | Learn more |
| www.qualtrics.com/xm-institute/ | Learn more |
| www.qualtrics.com/platform/security/ | Learn more |
| www.qualtrics.com/industries/financial-services/ | Learn more |
| www.qualtrics.com/industries/financial-services/ | Learn more |
| www.qualtrics.com/industries/financial-services/ | Learn more |
| www.qualtrics.com/industries/financial-services/ | Learn more |
Format your HTML in a way that enables crawlers to better understand your app’s content.
Send Feedback