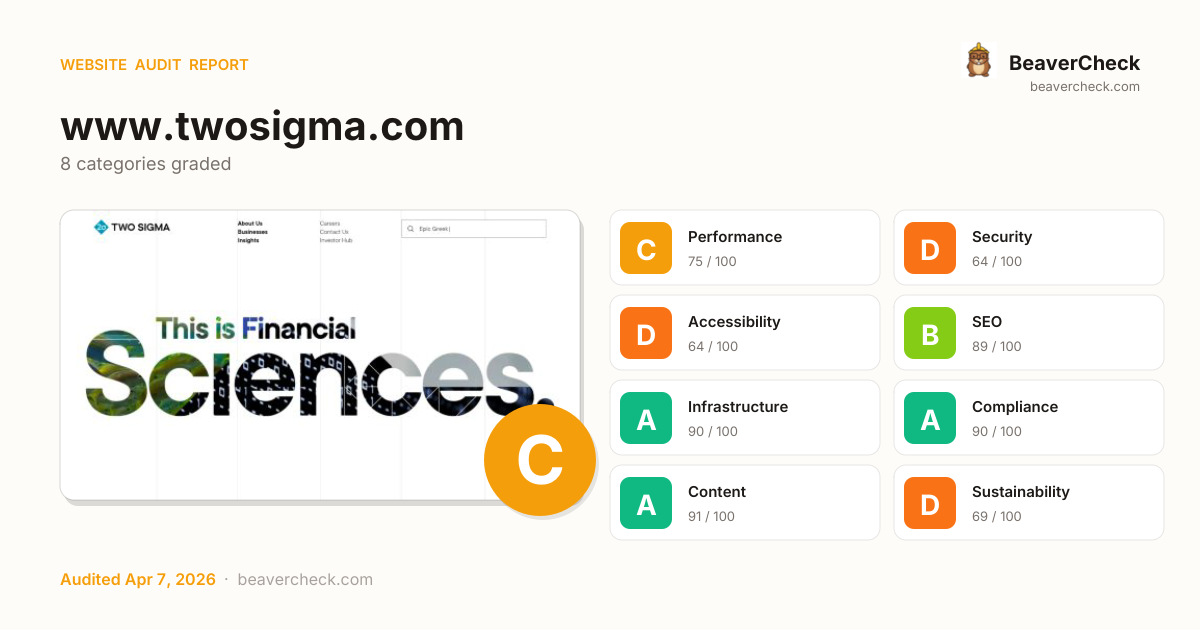
Mobile 375 × 812

Desktop 1440 × 900

Score: 75 / 100
Based on 8 categories, 0 sections
The overall score is a weighted average of individual category scores. Categories with more impact on user experience and security carry more weight.
Weights reflect general web best practices. Individual needs may differ.
Content-Security-Policy header is missing
No Content-Security-Policy header found
Page weighs 21.1 MB (10.6 MB transferred)
1 control(s) without accessible label
Cross-Origin-Embedder-Policy header is missing
[](https://beavercheck.com/results/c14dee19-abd5-b114-4c9d-df15bd75f7d1)<a href="https://beavercheck.com/results/c14dee19-abd5-b114-4c9d-df15bd75f7d1"><img src="https://beavercheck.com/badge?url=https%3A%2F%2Fwww.twosigma.com" alt="BeaverCheck Score"></a>https://beavercheck.com/badge?url=https%3A%2F%2Fwww.twosigma.comThis badge auto-updates with your latest scan result.
Thanks for your feedback!
Industry-standard audits powered by Google Lighthouse.
Key metrics that affect user experience.
First Contentful Paint First Contentful Paint — how long until the browser renders the first piece of content. Under 1.8s is good.
9.67 s
Largest Contentful Paint Largest Contentful Paint — how long until the largest visible element loads. Under 2.5s is good.
13.21 s
Total Blocking Time Total Blocking Time — total time the main thread was blocked, preventing user input. Under 200ms is good.
178 ms
Cumulative Layout Shift Cumulative Layout Shift — measures visual stability. How much the page layout shifts during loading. Under 0.1 is good.
0.104
Speed Index Speed Index — how quickly content is visually displayed during load. Under 3.4s is good.
9.67 s
Time to Interactive Time to Interactive — how long until the page is fully interactive and responds to user input. Under 3.8s is good.
13.58 s
Audit breakdown by category with detailed findings.
Remove large, duplicate JavaScript modules from bundles to reduce unnecessary bytes consumed by network activity.
Polyfills and transforms enable older browsers to use new JavaScript features. However, many aren't necessary for modern browsers. Consider modifying your JavaScript build process to not transpile Baseline features, unless you know you must support older browsers. Learn why most sites can deploy ES6+ code without transpiling
3rd party code can significantly impact load performance. Reduce and defer loading of 3rd party code to prioritize your page's content.
Layout shifts occur when elements move absent any user interaction. Investigate the causes of layout shifts, such as elements being added, removed, or their fonts changing as the page loads.
Consider setting font-display to swap or optional to ensure text is consistently visible. swap can be further optimized to mitigate layout shifts with font metric overrides.
Reducing the download time of images can improve the perceived load time of the page and LCP. Learn more about optimizing image size
| URL | Resource Size | Est Savings | |
|---|---|---|---|
div.cube-scene > div.cube > div.cube__face > div.cube-bg div.cube-scene > div.cube > div.cube__face > div.cube-bg | www.twosigma.com/wp-content/uploads/2023/04/cube-finSci2-mobile-1x.jpg | 225.3 KiB | 107.3 KiB |
li.card > div.articleCard__link > div.articleCard__content > img.articleCard__image li.card > div.articleCard__link > div.articleCard__content > img.articleCard__image | /wp-content/uploads/2025/11/data.as_.code_.hero_.sq_-scal... | 63.4 KiB | 44.2 KiB |
li.card > div.articleCard__link > div.articleCard__content > img.articleCard__image li.card > div.articleCard__link > div.articleCard__content > img.articleCard__image | /wp-content/uploads/2025/11/CWB_6126.sq_-scaled-532x532-c... | 26.8 KiB | 15.6 KiB |
li.card > div.articleCard__link > div.articleCard__content > img.articleCard__image li.card > div.articleCard__link > div.articleCard__content > img.articleCard__image | www.twosigma.com/wp-content/uploads/2026/01/Hero-scaled-532x532-c-default.png | 23.8 KiB | 13.9 KiB |
Each subpart has specific improvement strategies. Ideally, most of the LCP time should be spent on loading the resources, not within delays.
Optimize LCP by making the LCP image discoverable from the HTML immediately, and avoiding lazy-loading
Avoid chaining critical requests by reducing the length of chains, reducing the download size of resources, or deferring the download of unnecessary resources to improve page load.
Requests are blocking the page's initial render, which may delay LCP. Deferring or inlining can move these network requests out of the critical path.
A long cache lifetime can speed up repeat visits to your page. Learn more about caching.
| Request | Cache TTL | Transfer Size |
|---|---|---|
| /cdn-cgi/challenge-platform/h/b/scripts/jsd/625261456364/... | 14400.0 s | 12.6 KiB |
These insights are also available in the Chrome DevTools Performance Panel - record a trace to view more detailed information.
These are the largest layout shifts observed on the page. Each table item represents a single layout shift, and shows the element that shifted the most. Below each item are possible root causes that led to the layout shift. Some of these layout shifts may not be included in the CLS metric value due to windowing. Learn how to improve CLS
| Element | Layout shift score |
|---|---|
body.en > div#page > main#main-content > div.homepage-video-mobile body.en > div#page > main#main-content > div.homepage-video-mobile | 0.104 |
Time to Interactive is the amount of time it takes for the page to become fully interactive. Learn more about the Time to Interactive metric.
The maximum potential First Input Delay that your users could experience is the duration of the longest task. Learn more about the Maximum Potential First Input Delay metric.
Reduce unused rules from stylesheets and defer CSS not used for above-the-fold content to decrease bytes consumed by network activity. Learn how to reduce unused CSS.
| URL | Transfer Size | Est Savings |
|---|---|---|
| www.twosigma.com/wp-content/themes/tsmb/assets/public/build/site.css?ver=2.09 | 52.2 KiB | 49.3 KiB |
Reduce unused JavaScript and defer loading scripts until they are required to decrease bytes consumed by network activity. Learn how to reduce unused JavaScript.
| URL | Transfer Size | Est Savings |
|---|---|---|
| www.gstatic.com/recaptcha/releases/kUYUkUlSyqkjTSMaN2w3RaOh/recaptcha__en.js | 362.6 KiB | 161.3 KiB |
| /wp-content/themes/tsmb/assets/public/build/home-scripts.... | 206.0 KiB | 132.4 KiB |
| www.googletagmanager.com/gtag/js?id=UA-1613156-1 | 115.8 KiB | 75.4 KiB |
| www.twosigma.com/wp-includes/js/jquery/jquery.min.js?ver=3.7.1 | 30.8 KiB | 20.1 KiB |
Consider reducing the time spent parsing, compiling, and executing JS. You may find delivering smaller JS payloads helps with this. Learn how to reduce Javascript execution time.
| URL | Total CPU Time | Script Evaluation | Script Parse |
|---|---|---|---|
| www.twosigma.com/ | 9.5 s | 37 ms | 4.4 ms |
| Unattributable | 1.3 s | 23 ms | 0.0 ms |
| www.gstatic.com/recaptcha/releases/kUYUkUlSyqkjTSMaN2w3RaOh/recaptcha__en.js | 1.2 s | 1.0 s | 81 ms |
| /wp-content/themes/tsmb/assets/public/build/home-scripts.... | 708 ms | 319 ms | 90 ms |
| www.twosigma.com/cdn-cgi/challenge-platform/scripts/jsd/main.js | 218 ms | 208 ms | 2.5 ms |
| www.googletagmanager.com/gtag/js?id=UA-1613156-1 | 96 ms | 64 ms | 31 ms |
| www.twosigma.com/wp-includes/js/jquery/jquery.min.js?ver=3.7.1 | 64 ms | 39 ms | 7.6 ms |
Consider reducing the time spent parsing, compiling and executing JS. You may find delivering smaller JS payloads helps with this. Learn how to minimize main-thread work
| Category | Time Spent |
|---|---|
| Style & Layout | 9.2 s |
| Script Evaluation | 1.9 s |
| Other | 1.7 s |
| Script Parsing & Compilation | 234 ms |
| Rendering | 95 ms |
| Parse HTML & CSS | 81 ms |
| Garbage Collection | 69 ms |
Minifying JavaScript files can reduce payload sizes and script parse time. Learn how to minify JavaScript.
| URL | Transfer Size | Est Savings |
|---|---|---|
| /wp-content/plugins/cf7-conditional-fields/js/scripts.js?... | 8.7 KiB | 3.7 KiB |
Large network payloads cost users real money and are highly correlated with long load times. Learn how to reduce payload sizes.
Set an explicit width and height on image elements to reduce layout shifts and improve CLS. Learn how to set image dimensions
| URL | |
|---|---|
li.card > div.articleCard__link > div.articleCard__content > img.articleCard__image li.card > div.articleCard__link > div.articleCard__content > img.articleCard__image | www.twosigma.com/wp-content/uploads/2026/01/Hero-scaled-532x532-c-default.png |
li.card > div.articleCard__link > div.articleCard__content > img.articleCard__image li.card > div.articleCard__link > div.articleCard__content > img.articleCard__image | /wp-content/uploads/2025/11/CWB_6126.sq_-scaled-532x532-c... |
li.card > div.articleCard__link > div.articleCard__content > img.articleCard__image li.card > div.articleCard__link > div.articleCard__content > img.articleCard__image | /wp-content/uploads/2025/11/data.as_.code_.hero_.sq_-scal... |
This is Financial Sciences. div#page > main#main-content > div.homepage-title-mobile > img | /wp-content/themes/tsmb/assets/public/img/mobile-homepage... |
two sigma logo header.globalHeader > div.globalHeader__content > a.globalHeader__branding > img.logo-mobile | www.twosigma.com/wp-content/themes/tsmb/assets/public/img/logo-diamond.svg |
div.content > nav.globalFooter__menus > div.globalFooter__menu > img.quickLinks__icon div.content > nav.globalFooter__menus > div.globalFooter__menu > img.quickLinks__icon | www.twosigma.com/wp-content/themes/tsmb/assets/public/img/plus.svg |
Open div.globalHeader__content > div.globalHeader__navTrigger > button.globalHeader__trigger > img | www.twosigma.com/wp-content/themes/tsmb/assets/public/img/nav-arrow-black.svg |
More information about the performance of your application. These numbers don't directly affect the Performance score.
These checks highlight opportunities to improve the accessibility of your web app. Automatic detection can only detect a subset of issues and does not guarantee the accessibility of your web app, so manual testing is also encouraged.
Screen readers have a specific way of announcing lists. Ensuring proper list structure aids screen reader output. Learn more about proper list structure.
| Failing Elements |
|---|
Data Science, Engineering
AI in Investment Management: 2026 Outlook (Part I)
Wo… div.relatedArticles > div.content > div > ul.relatedArticles__cards |
Screen readers require list items (`<li>`) to be contained within a parent `<ul>`, `<ol>` or `<menu>` to be announced properly. Learn more about proper list structure.
| Failing Elements |
|---|
Data Science, Engineering
AI in Investment Management: 2026 Outlook (Part I) ul.relatedArticles__cards > div.flickity-viewport > div.flickity-slider > li.card |
These are opportunities to improve the experience of reading tabular or list data using assistive technology, like a screen reader.
A value greater than 0 implies an explicit navigation ordering. Although technically valid, this often creates frustrating experiences for users who rely on assistive technologies. Learn more about the `tabindex` attribute.
| Failing Elements |
|---|
Accept div.content > div.cookieBar-actions > div.cookieBar-buttons > button.button |
Reject div.content > div.cookieBar-actions > div.cookieBar-buttons > button.button |
These are opportunities to improve keyboard navigation in your application.
Deprecated APIs will eventually be removed from the browser. Learn more about deprecated APIs.
| Deprecation / Warning | Source |
|---|---|
| SharedStorage | |
| StorageType.persistent is deprecated. Please use standardized navigator.storage instead. | |
| Fledge |
Source maps translate minified code to the original source code. This helps developers debug in production. In addition, Lighthouse is able to provide further insights. Consider deploying source maps to take advantage of these benefits. Learn more about source maps.
These checks ensure that your page is following basic search engine optimization advice. There are many additional factors Lighthouse does not score here that may affect your search ranking, including performance on Core Web Vitals. Learn more about Google Search Essentials.
Descriptive link text helps search engines understand your content. Learn how to make links more accessible.
Format your HTML in a way that enables crawlers to better understand your app’s content.
Industry-standard audits powered by Google Lighthouse. — Desktop
Key metrics that affect user experience. — Desktop
First Contentful Paint First Contentful Paint — how long until the browser renders the first piece of content. Under 1.8s is good.
824 ms
Largest Contentful Paint Largest Contentful Paint — how long until the largest visible element loads. Under 2.5s is good.
2.23 s
Total Blocking Time Total Blocking Time — total time the main thread was blocked, preventing user input. Under 200ms is good.
18.63 s
Cumulative Layout Shift Cumulative Layout Shift — measures visual stability. How much the page layout shifts during loading. Under 0.1 is good.
0.610
Speed Index Speed Index — how quickly content is visually displayed during load. Under 3.4s is good.
12.30 s
Time to Interactive Time to Interactive — how long until the page is fully interactive and responds to user input. Under 3.8s is good.
24.83 s
Audit breakdown by category with detailed findings.
Remove large, duplicate JavaScript modules from bundles to reduce unnecessary bytes consumed by network activity.
Polyfills and transforms enable older browsers to use new JavaScript features. However, many aren't necessary for modern browsers. Consider modifying your JavaScript build process to not transpile Baseline features, unless you know you must support older browsers. Learn why most sites can deploy ES6+ code without transpiling
3rd party code can significantly impact load performance. Reduce and defer loading of 3rd party code to prioritize your page's content.
Layout shifts occur when elements move absent any user interaction. Investigate the causes of layout shifts, such as elements being added, removed, or their fonts changing as the page loads.
Consider setting font-display to swap or optional to ensure text is consistently visible. swap can be further optimized to mitigate layout shifts with font metric overrides.
Optimize LCP by making the LCP image discoverable from the HTML immediately, and avoiding lazy-loading
Avoid chaining critical requests by reducing the length of chains, reducing the download size of resources, or deferring the download of unnecessary resources to improve page load.
Requests are blocking the page's initial render, which may delay LCP. Deferring or inlining can move these network requests out of the critical path.
A long cache lifetime can speed up repeat visits to your page. Learn more about caching.
| Request | Cache TTL | Transfer Size |
|---|---|---|
| /cdn-cgi/challenge-platform/h/b/scripts/jsd/625261456364/... | 14400.0 s | 12.3 KiB |
Reducing the download time of images can improve the perceived load time of the page and LCP. Learn more about optimizing image size
| URL | Resource Size | Est Savings | |
|---|---|---|---|
li.card > div.articleCard__link > div.articleCard__content > img.articleCard__image li.card > div.articleCard__link > div.articleCard__content > img.articleCard__image | /wp-content/uploads/2025/11/data.as_.code_.hero_.sq_-scal... | 63.4 KiB | 51.4 KiB |
li.card > div.articleCard__link > div.articleCard__content > img.articleCard__image li.card > div.articleCard__link > div.articleCard__content > img.articleCard__image | /wp-content/uploads/2025/11/CWB_6126.sq_-scaled-532x532-c... | 26.8 KiB | 19.8 KiB |
li.card > div.articleCard__link > div.articleCard__content > img.articleCard__image li.card > div.articleCard__link > div.articleCard__content > img.articleCard__image | www.twosigma.com/wp-content/uploads/2026/01/Hero-scaled-532x532-c-default.png | 23.8 KiB | 17.6 KiB |
These insights are also available in the Chrome DevTools Performance Panel - record a trace to view more detailed information.
Time to Interactive is the amount of time it takes for the page to become fully interactive. Learn more about the Time to Interactive metric.
The maximum potential First Input Delay that your users could experience is the duration of the longest task. Learn more about the Maximum Potential First Input Delay metric.
These are the largest layout shifts observed on the page. Each table item represents a single layout shift, and shows the element that shifted the most. Below each item are possible root causes that led to the layout shift. Some of these layout shifts may not be included in the CLS metric value due to windowing. Learn how to improve CLS
| Element | Layout shift score |
|---|---|
Our people advance our understanding of the world.
This is an auto-rotating ca… body.en > div#page > main#main-content > div.page | 0.610 |
| div.globalHeader__search > form#global-header-search-form > span.searchTeasers__term-container > span.Typewriter__cursor | 0.000 |
| div.globalHeader__search > form#global-header-search-form > span.searchTeasers__term-container > span.Typewriter__cursor | 0.000 |
| div.globalHeader__search > form#global-header-search-form > span.searchTeasers__term-container > span.Typewriter__cursor | 0.000 |
| div.globalHeader__search > form#global-header-search-form > span.searchTeasers__term-container > span.Typewriter__cursor | 0.000 |
| div.globalHeader__search > form#global-header-search-form > span.searchTeasers__term-container > span.Typewriter__cursor | 0.000 |
| div.globalHeader__search > form#global-header-search-form > span.searchTeasers__term-container > span.Typewriter__cursor | 0.000 |
| div.globalHeader__search > form#global-header-search-form > span.searchTeasers__term-container > span.Typewriter__cursor | 0.000 |
| div.globalHeader__search > form#global-header-search-form > span.searchTeasers__term-container > span.Typewriter__cursor | 0.000 |
| div.globalHeader__search > form#global-header-search-form > span.searchTeasers__term-container > span.Typewriter__cursor | 0.000 |
| div.globalHeader__search > form#global-header-search-form > span.searchTeasers__term-container > span.Typewriter__cursor | 0.000 |
| div.globalHeader__search > form#global-header-search-form > span.searchTeasers__term-container > span.Typewriter__cursor | 0.000 |
| div.globalHeader__search > form#global-header-search-form > span.searchTeasers__term-container > span.Typewriter__cursor | 0.000 |
| div.globalHeader__search > form#global-header-search-form > span.searchTeasers__term-container > span.Typewriter__cursor | 0.000 |
| div.globalHeader__search > form#global-header-search-form > span.searchTeasers__term-container > span.Typewriter__cursor | 0.000 |
Reduce unused rules from stylesheets and defer CSS not used for above-the-fold content to decrease bytes consumed by network activity. Learn how to reduce unused CSS.
| URL | Transfer Size | Est Savings |
|---|---|---|
| www.twosigma.com/wp-content/themes/tsmb/assets/public/build/site.css?ver=2.09 | 52.1 KiB | 47.8 KiB |
Reduce unused JavaScript and defer loading scripts until they are required to decrease bytes consumed by network activity. Learn how to reduce unused JavaScript.
| URL | Transfer Size | Est Savings |
|---|---|---|
| www.gstatic.com/recaptcha/releases/kUYUkUlSyqkjTSMaN2w3RaOh/recaptcha__en.js | 362.6 KiB | 169.6 KiB |
| /wp-content/themes/tsmb/assets/public/build/home-scripts.... | 206.0 KiB | 99.1 KiB |
| www.googletagmanager.com/gtag/js?id=UA-1613156-1 | 115.8 KiB | 75.4 KiB |
| www.twosigma.com/wp-includes/js/jquery/jquery.min.js?ver=3.7.1 | 30.8 KiB | 20.1 KiB |
Consider reducing the time spent parsing, compiling, and executing JS. You may find delivering smaller JS payloads helps with this. Learn how to reduce Javascript execution time.
| URL | Total CPU Time | Script Evaluation | Script Parse |
|---|---|---|---|
| /wp-content/themes/tsmb/assets/public/build/home-scripts.... | 42.5 s | 2.9 s | 28 ms |
| Unattributable | 1.0 s | 245 ms | 0.0 ms |
| www.gstatic.com/recaptcha/releases/kUYUkUlSyqkjTSMaN2w3RaOh/recaptcha__en.js | 565 ms | 398 ms | 115 ms |
| www.twosigma.com/cdn-cgi/challenge-platform/scripts/jsd/main.js | 257 ms | 243 ms | 3.7 ms |
| www.twosigma.com/ | 237 ms | 24 ms | 1.9 ms |
| www.googletagmanager.com/gtag/js?id=UA-1613156-1 | 52 ms | 23 ms | 29 ms |
Consider reducing the time spent parsing, compiling and executing JS. You may find delivering smaller JS payloads helps with this. Learn how to minimize main-thread work
| Category | Time Spent |
|---|---|
| Other | 40.2 s |
| Script Evaluation | 3.9 s |
| Style & Layout | 208 ms |
| Script Parsing & Compilation | 188 ms |
| Garbage Collection | 135 ms |
| Rendering | 92 ms |
| Parse HTML & CSS | 47 ms |
Minifying JavaScript files can reduce payload sizes and script parse time. Learn how to minify JavaScript.
| URL | Transfer Size | Est Savings |
|---|---|---|
| /wp-content/plugins/cf7-conditional-fields/js/scripts.js?... | 8.7 KiB | 3.7 KiB |
Large network payloads cost users real money and are highly correlated with long load times. Learn how to reduce payload sizes.
Set an explicit width and height on image elements to reduce layout shifts and improve CLS. Learn how to set image dimensions
| URL | |
|---|---|
li.card > div.articleCard__link > div.articleCard__content > img.articleCard__image li.card > div.articleCard__link > div.articleCard__content > img.articleCard__image | www.twosigma.com/wp-content/uploads/2026/01/Hero-scaled-532x532-c-default.png |
li.card > div.articleCard__link > div.articleCard__content > img.articleCard__image li.card > div.articleCard__link > div.articleCard__content > img.articleCard__image | /wp-content/uploads/2025/11/CWB_6126.sq_-scaled-532x532-c... |
li.card > div.articleCard__link > div.articleCard__content > img.articleCard__image li.card > div.articleCard__link > div.articleCard__content > img.articleCard__image | /wp-content/uploads/2025/11/data.as_.code_.hero_.sq_-scal... |
two sigma logo header.globalHeader > div.globalHeader__content > a.globalHeader__branding > img.logo-desktop | www.twosigma.com/wp-content/themes/tsmb/assets/public/img/logo.svg |
div.content > nav.globalFooter__menus > div.globalFooter__menu > img.quickLinks__icon div.content > nav.globalFooter__menus > div.globalFooter__menu > img.quickLinks__icon | www.twosigma.com/wp-content/themes/tsmb/assets/public/img/plus.svg |
More information about the performance of your application. These numbers don't directly affect the Performance score.
These checks highlight opportunities to improve the accessibility of your web app. Automatic detection can only detect a subset of issues and does not guarantee the accessibility of your web app, so manual testing is also encouraged.
A value greater than 0 implies an explicit navigation ordering. Although technically valid, this often creates frustrating experiences for users who rely on assistive technologies. Learn more about the `tabindex` attribute.
| Failing Elements |
|---|
Accept div.content > div.cookieBar-actions > div.cookieBar-buttons > button.button |
Reject div.content > div.cookieBar-actions > div.cookieBar-buttons > button.button |
These are opportunities to improve keyboard navigation in your application.
Touch targets with sufficient size and spacing help users who may have difficulty targeting small controls to activate the targets. Learn more about touch targets.
| Failing Elements |
|---|
About Us div.globalHeader__menu > ul.globalHeader__links > li.menu-item > a.link--is-single |
Businesses div.globalHeader__menu > ul.globalHeader__links > li.menu-item > a.link--is-parent |
Contact Us div.globalHeader__menu > ul.globalHeader__links > li.menu-item > a.link--is-single |
Investor Hub div.globalHeader__menu > ul.globalHeader__links > li.js-modal-last > a.link--is-single |
Click to see search results div.globalHeader__menu > div.globalHeader__search > form#global-header-search-form > input.search-submit |
These items highlight common accessibility best practices.
Deprecated APIs will eventually be removed from the browser. Learn more about deprecated APIs.
| Deprecation / Warning | Source |
|---|---|
| SharedStorage | |
| StorageType.persistent is deprecated. Please use standardized navigator.storage instead. | |
| Fledge |
Source maps translate minified code to the original source code. This helps developers debug in production. In addition, Lighthouse is able to provide further insights. Consider deploying source maps to take advantage of these benefits. Learn more about source maps.
These checks ensure that your page is following basic search engine optimization advice. There are many additional factors Lighthouse does not score here that may affect your search ranking, including performance on Core Web Vitals. Learn more about Google Search Essentials.
Descriptive link text helps search engines understand your content. Learn how to make links more accessible.
Format your HTML in a way that enables crawlers to better understand your app’s content.
Send Feedback