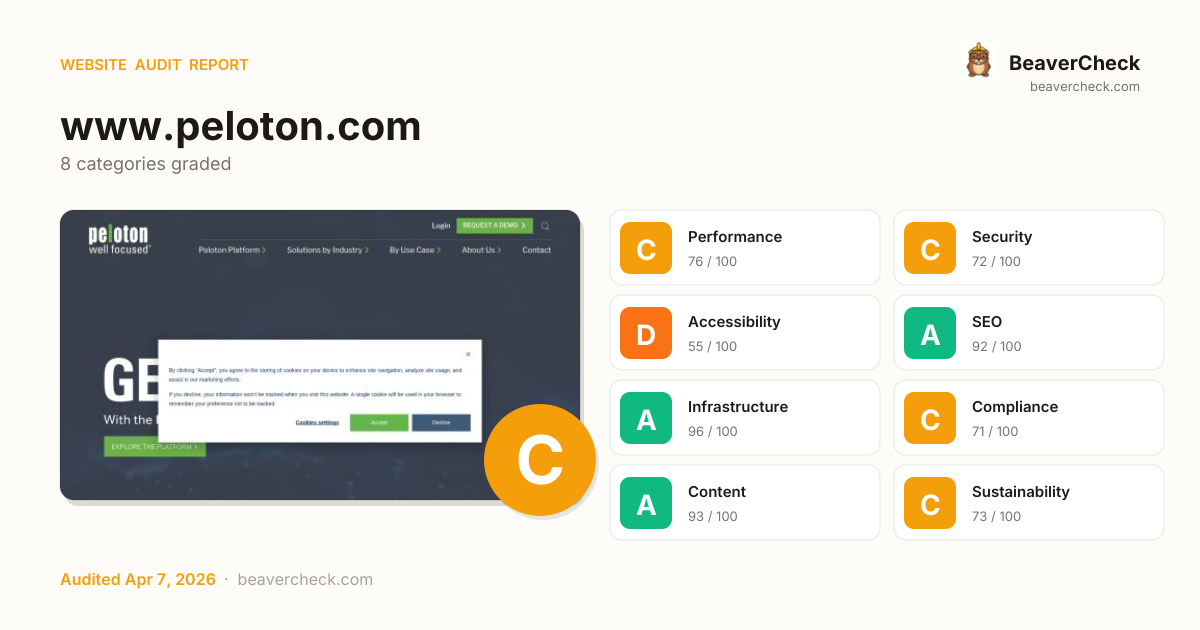
Mobile 375 × 812

Desktop 1440 × 900

Score: 76 / 100
Based on 8 categories, 0 sections
The overall score is a weighted average of individual category scores. Categories with more impact on user experience and security carry more weight.
Weights reflect general web best practices. Individual needs may differ.
'unsafe-eval' found in script source
'unsafe-inline' found in script source
Page weighs 8.6 MB (4.2 MB transferred)
2 link(s) with no accessible text
No H1 heading found
[](https://beavercheck.com/results/d115b30a-0c0c-8e05-b786-83130bc94744)<a href="https://beavercheck.com/results/d115b30a-0c0c-8e05-b786-83130bc94744"><img src="https://beavercheck.com/badge?url=https%3A%2F%2Fwww.peloton.com" alt="BeaverCheck Score"></a>https://beavercheck.com/badge?url=https%3A%2F%2Fwww.peloton.comThis badge auto-updates with your latest scan result.
Thanks for your feedback!
Industry-standard audits powered by Google Lighthouse.
Key metrics that affect user experience.
First Contentful Paint First Contentful Paint — how long until the browser renders the first piece of content. Under 1.8s is good.
3.03 s
Largest Contentful Paint Largest Contentful Paint — how long until the largest visible element loads. Under 2.5s is good.
19.61 s
Total Blocking Time Total Blocking Time — total time the main thread was blocked, preventing user input. Under 200ms is good.
1.45 s
Cumulative Layout Shift Cumulative Layout Shift — measures visual stability. How much the page layout shifts during loading. Under 0.1 is good.
0.000
Speed Index Speed Index — how quickly content is visually displayed during load. Under 3.4s is good.
8.04 s
Time to Interactive Time to Interactive — how long until the page is fully interactive and responds to user input. Under 3.8s is good.
19.90 s
Audit breakdown by category with detailed findings.
Remove large, duplicate JavaScript modules from bundles to reduce unnecessary bytes consumed by network activity.
Polyfills and transforms enable older browsers to use new JavaScript features. However, many aren't necessary for modern browsers. Consider modifying your JavaScript build process to not transpile Baseline features, unless you know you must support older browsers. Learn why most sites can deploy ES6+ code without transpiling
3rd party code can significantly impact load performance. Reduce and defer loading of 3rd party code to prioritize your page's content.
A long cache lifetime can speed up repeat visits to your page. Learn more about caching.
Consider setting font-display to swap or optional to ensure text is consistently visible. swap can be further optimized to mitigate layout shifts with font metric overrides.
| URL | Est Savings |
|---|---|
| /hubfs/21730018/raw_assets/public/Stage Peloton/Fonts/Uni... | 130 ms |
A forced reflow occurs when JavaScript queries geometric properties (such as offsetWidth) after styles have been invalidated by a change to the DOM state. This can result in poor performance. Learn more about forced reflows and possible mitigations.
Reducing the download time of images can improve the perceived load time of the page and LCP. Learn more about optimizing image size
| URL | Resource Size | Est Savings | |
|---|---|---|---|
Geospatial Asset Analysis div.use-cases-list > div.use-case > div.use-case-inner > div.use-case-front | www.peloton.com/hubfs/usecase3.png | 197.5 KiB | 173.1 KiB |
Legal
Cookie Settings
Exercise your Rights
© Peloton 1991 - Present footer.footer > div.plt-footer > div#hs_cos_wrapper_footer > div.footer-content | www.peloton.com/hubfs/banner-bg-2.png | 478.2 KiB | 168.5 KiB |
platforum-mobile div.slick-track > div.update-banner > div.update-banner-bg > img.mobile-img | /hs-fs/hubfs/platforum-mobile.png?width=947&height=1184&n... | 174.1 KiB | 135.9 KiB |
Production Operations Oversight div.use-cases-list > div.use-case > div.use-case-inner > div.use-case-front | www.peloton.com/hubfs/usecase5.png | 137.8 KiB | 114.6 KiB |
Hydraulic Frac Data Centralization div.use-cases-list > div.use-case > div.use-case-inner > div.use-case-front | www.peloton.com/hubfs/usecase4.png | 131.3 KiB | 108.1 KiB |
div.span12 > div#hs_cos_wrapper_widget_1732794083696 > div.pt-banner-slider > div.pt-anim-banner-slide div.span12 > div#hs_cos_wrapper_widget_1732794083696 > div.pt-banner-slider > div.pt-anim-banner-slide | www.peloton.com/hubfs/banner-bg.png | 375.0 KiB | 103.3 KiB |
mobile-bg-1 div.slick-track > div.update-banner > div.update-banner-bg > img.mobile-img | /hs-fs/hubfs/mobile-bg-1.png?width=804&height=890&name=mo... | 110.4 KiB | 85.9 KiB |
Facility Construction & Commissioning div.use-cases-list > div.use-case > div.use-case-inner > div.use-case-front | www.peloton.com/hubfs/drilling-completions.png | 77.8 KiB | 61.8 KiB |
Asset Integrity Monitoring div.use-cases-list > div.use-case > div.use-case-inner > div.use-case-front | www.peloton.com/hubfs/usecase2.png | 68.7 KiB | 44.3 KiB |
mobile-bg-2 div.slick-track > div.update-banner > div.update-banner-bg > img.mobile-img | /hs-fs/hubfs/mobile-bg-2.png?width=804&height=890&name=mo... | 66.5 KiB | 42.0 KiB |
star-link-bg div.slick-track > div.update-banner > div.update-banner-bg > img | /hs-fs/hubfs/star-link-bg.png?width=890&height=120&name=s... | 8.6 KiB | 6.8 KiB |
Optimize LCP by making the LCP image discoverable from the HTML immediately, and avoiding lazy-loading
Avoid chaining critical requests by reducing the length of chains, reducing the download size of resources, or deferring the download of unnecessary resources to improve page load.
Requests are blocking the page's initial render, which may delay LCP. Deferring or inlining can move these network requests out of the critical path.
These insights are also available in the Chrome DevTools Performance Panel - record a trace to view more detailed information.
Time to Interactive is the amount of time it takes for the page to become fully interactive. Learn more about the Time to Interactive metric.
The maximum potential First Input Delay that your users could experience is the duration of the longest task. Learn more about the Maximum Potential First Input Delay metric.
Minifying JavaScript files can reduce payload sizes and script parse time. Learn how to minify JavaScript.
| URL | Transfer Size | Est Savings |
|---|---|---|
| /hubfs/hub_generated/template_assets/1/183226165104/17754... | 83.5 KiB | 42.7 KiB |
Reduce unused JavaScript and defer loading scripts until they are required to decrease bytes consumed by network activity. Learn how to reduce unused JavaScript.
| URL | Transfer Size | Est Savings |
|---|---|---|
| unpkg.com/@dotlottie/player-component@latest/dist/dotlottie-player.js | 495.6 KiB | 448.7 KiB |
| www.peloton.com/_hcms/forms/v2.js | 193.1 KiB | 112.2 KiB |
| www.googletagmanager.com/gtag/js?id=AW-16508021088&cx=c>m=4e6460 | 142.9 KiB | 105.1 KiB |
| www.googletagmanager.com/gtag/js?id=G-TZN35GWCZ2&cx=c>m=4e6460 | 160.6 KiB | 66.3 KiB |
| www.googletagmanager.com/gtm.js?id=GTM-WFZLP8J2 | 152.0 KiB | 62.5 KiB |
| www.googletagmanager.com/gtag/js?id=AW-16508021088 | 142.9 KiB | 55.2 KiB |
| /hubfs/hub_generated/template_assets/1/183226165104/17754... | 83.5 KiB | 33.9 KiB |
Consider reducing the time spent parsing, compiling, and executing JS. You may find delivering smaller JS payloads helps with this. Learn how to reduce Javascript execution time.
| URL | Total CPU Time | Script Evaluation | Script Parse |
|---|---|---|---|
| scripts.clarity.ms/0.8.60-beta/clarity.js | 1.8 s | 1.3 s | 11 ms |
| www.peloton.com/ | 1.2 s | 201 ms | 250 ms |
| Unattributable | 1.2 s | 27 ms | 0.0 ms |
| unpkg.com/@dotlottie/player-component@latest/dist/dotlottie-player.js | 952 ms | 852 ms | 0.0 ms |
| js.hs-analytics.net/analytics/1775593200000/21730018.js | 765 ms | 519 ms | 12 ms |
| www.googletagmanager.com/gtm.js?id=GTM-WFZLP8J2 | 365 ms | 293 ms | 56 ms |
| /hubfs/hub_generated/template_assets/1/183226165104/17754... | 340 ms | 185 ms | 41 ms |
| www.googletagmanager.com/gtag/js?id=AW-16508021088 | 312 ms | 260 ms | 49 ms |
| www.googletagmanager.com/gtag/js?id=G-TZN35GWCZ2&cx=c>m=4e6460 | 309 ms | 249 ms | 57 ms |
| www.peloton.com/_hcms/forms/v2.js | 162 ms | 83 ms | 75 ms |
| js.hscollectedforms.net/collectedforms.js | 98 ms | 71 ms | 10 ms |
| js.hubspot.com/web-interactives-embed.js | 97 ms | 59 ms | 21 ms |
| snap.licdn.com/li.lms-analytics/insight.min.js | 95 ms | 69 ms | 21 ms |
| js.hs-banner.com/v2/21730018/banner.js | 94 ms | 62 ms | 8.6 ms |
| www.googletagmanager.com/gtag/js?id=AW-16508021088&cx=c>m=4e6460 | 77 ms | 25 ms | 51 ms |
Consider reducing the time spent parsing, compiling and executing JS. You may find delivering smaller JS payloads helps with this. Learn how to minimize main-thread work
| Category | Time Spent |
|---|---|
| Script Evaluation | 4.8 s |
| Other | 1.6 s |
| Style & Layout | 811 ms |
| Script Parsing & Compilation | 691 ms |
| Rendering | 280 ms |
| Garbage Collection | 212 ms |
| Parse HTML & CSS | 118 ms |
Large network payloads cost users real money and are highly correlated with long load times. Learn how to reduce payload sizes.
More information about the performance of your application. These numbers don't directly affect the Performance score.
These checks highlight opportunities to improve the accessibility of your web app. Automatic detection can only detect a subset of issues and does not guarantee the accessibility of your web app, so manual testing is also encouraged.
When an element doesn't have an accessible name, screen readers announce it with a generic name, making it unusable for users who rely on screen readers. Learn how to make command elements more accessible.
| Failing Elements |
|---|
div.header__navigation_mob > nav > div.mobile-menu-panel-header > div.header_close_icon div.header__navigation_mob > nav > div.mobile-menu-panel-header > div.header_close_icon |
These are opportunities to improve the usage of ARIA in your application which may enhance the experience for users of assistive technology, like a screen reader.
Low-contrast text is difficult or impossible for many users to read. Learn how to provide sufficient color contrast.
| Failing Elements |
|---|
Accept div#hs-eu-cookie-confirmation-buttons-area > div#hs-eu-confirmation-button-group > div#hs-eu-opt-in-buttons > button#hs-eu-confirmation-button |
LEARN MORE div.container > div.update-banner-row > div.update-banner-link > a |
USE CASES div.use-cases-row > div.use-cases-heading-wrap > div.use-cases-heading-left > div.use-case-subtitle |
MORE USE CASES div.container > div.use-cases-row > a.pb-more-btn > span |
Our Company div.two-column-tab-content > div.two-column-tab-content-row > div.two-column-tab-buttons > button.two-column-tab-btn |
FIND OUT MORE div.two-column-tab-content > div.two-column-tab-content-row > div#tab_1 > a.pt-btn |
FIND OUT MORE div.two-column-img-text-section > div.two-column-section-content > div.two-column-section-content-wrap > a.pt-btn |
These are opportunities to improve the legibility of your content.
Properly ordered headings that do not skip levels convey the semantic structure of the page, making it easier to navigate and understand when using assistive technologies. Learn more about heading order.
| Failing Elements |
|---|
PRODUCTION DATA LIFECYCLE div.box_circle_content > div.box_circle > div.bc_box_title > h5 |
These are opportunities to improve keyboard navigation in your application.
Deprecated APIs will eventually be removed from the browser. Learn more about deprecated APIs.
| Deprecation / Warning | Source |
|---|---|
| AttributionReporting |
Errors logged to the console indicate unresolved problems. They can come from network request failures and other browser concerns. Learn more about this errors in console diagnostic audit
| Source | Description |
|---|---|
Failed to load resource: the server responded with a status of 404 () | |
TypeError: Cannot read properties of null (reading 'addEventListener')
at HTMLDocument.<anonymous> (https://21730018.fs1.hubspotusercontent-na1.net/hubfs/21730018/hub_generated/module_assets/1/183215645283/1775135981203/module_Header_Right.js:1:141) |
Source maps translate minified code to the original source code. This helps developers debug in production. In addition, Lighthouse is able to provide further insights. Consider deploying source maps to take advantage of these benefits. Learn more about source maps.
These checks ensure that your page is following basic search engine optimization advice. There are many additional factors Lighthouse does not score here that may affect your search ranking, including performance on Core Web Vitals. Learn more about Google Search Essentials.
Descriptive link text helps search engines understand your content. Learn how to make links more accessible.
| Link destination | Link Text |
|---|---|
| communications.peloton.com/2026-peloton-platforum?hsLang=en | LEARN MORE |
| /peloton?utm_source=starlink&utm_medium=banner&utm_campai... | LEARN MORE |
| www.peloton.com/products/well-data-lifecycle/peloton-innova?hsLang=en | LEARN MORE |
| www.peloton.com/renewables?hsLang=en | LEARN MORE |
Format your HTML in a way that enables crawlers to better understand your app’s content.
Industry-standard audits powered by Google Lighthouse. — Desktop
Key metrics that affect user experience. — Desktop
First Contentful Paint First Contentful Paint — how long until the browser renders the first piece of content. Under 1.8s is good.
787 ms
Largest Contentful Paint Largest Contentful Paint — how long until the largest visible element loads. Under 2.5s is good.
1.55 s
Total Blocking Time Total Blocking Time — total time the main thread was blocked, preventing user input. Under 200ms is good.
26 ms
Cumulative Layout Shift Cumulative Layout Shift — measures visual stability. How much the page layout shifts during loading. Under 0.1 is good.
0.005
Speed Index Speed Index — how quickly content is visually displayed during load. Under 3.4s is good.
2.43 s
Time to Interactive Time to Interactive — how long until the page is fully interactive and responds to user input. Under 3.8s is good.
3.97 s
Audit breakdown by category with detailed findings.
Remove large, duplicate JavaScript modules from bundles to reduce unnecessary bytes consumed by network activity.
Polyfills and transforms enable older browsers to use new JavaScript features. However, many aren't necessary for modern browsers. Consider modifying your JavaScript build process to not transpile Baseline features, unless you know you must support older browsers. Learn why most sites can deploy ES6+ code without transpiling
3rd party code can significantly impact load performance. Reduce and defer loading of 3rd party code to prioritize your page's content.
Consider setting font-display to swap or optional to ensure text is consistently visible. swap can be further optimized to mitigate layout shifts with font metric overrides.
| URL | Est Savings |
|---|---|
| /hubfs/21730018/raw_assets/public/Stage Peloton/Fonts/Uni... | 70 ms |
A forced reflow occurs when JavaScript queries geometric properties (such as offsetWidth) after styles have been invalidated by a change to the DOM state. This can result in poor performance. Learn more about forced reflows and possible mitigations.
Optimize LCP by making the LCP image discoverable from the HTML immediately, and avoiding lazy-loading
Avoid chaining critical requests by reducing the length of chains, reducing the download size of resources, or deferring the download of unnecessary resources to improve page load.
Requests are blocking the page's initial render, which may delay LCP. Deferring or inlining can move these network requests out of the critical path.
A long cache lifetime can speed up repeat visits to your page. Learn more about caching.
Reducing the download time of images can improve the perceived load time of the page and LCP. Learn more about optimizing image size
| URL | Resource Size | Est Savings | |
|---|---|---|---|
star-link-bg div.slick-track > div.update-banner > div.update-banner-bg > img | /hs-fs/hubfs/star-link-bg.png?width=1779&height=240&name=... | 366.7 KiB | 320.0 KiB |
ourcompany_bg div#hs_cos_wrapper_widget_1733061624882 > div.two-column-tab > div.two-column-tab-image > img | /hs-fs/hubfs/ourcompany_bg.png?width=904&height=591&name=... | 369.3 KiB | 312.7 KiB |
Variant4 div.slick-track > div.update-banner > div.update-banner-bg > img.desktop-img | www.peloton.com/hs-fs/hubfs/Variant4.png?width=1779&height=241&name=Variant4.png | 359.4 KiB | 311.2 KiB |
Geospatial Asset Analysis div.use-cases-list > div.use-case > div.use-case-inner > div.use-case-front | www.peloton.com/hubfs/usecase3.png | 197.5 KiB | 173.1 KiB |
Legal
Cookie Settings
Exercise your Rights
© Peloton 1991 - Present footer.footer > div.plt-footer > div#hs_cos_wrapper_footer > div.footer-content | www.peloton.com/hubfs/banner-bg-2.png | 478.2 KiB | 168.5 KiB |
Platforum 2026 div.slick-track > div.update-banner > div.update-banner-bg > img.desktop-img | /hs-fs/hubfs/plaforum-secondary-slider-bg.png?width=1779&... | 166.7 KiB | 118.9 KiB |
Production Operations Oversight div.use-cases-list > div.use-case > div.use-case-inner > div.use-case-front | www.peloton.com/hubfs/usecase5.png | 137.8 KiB | 114.6 KiB |
Hydraulic Frac Data Centralization div.use-cases-list > div.use-case > div.use-case-inner > div.use-case-front | www.peloton.com/hubfs/usecase4.png | 131.3 KiB | 108.1 KiB |
div.span12 > div#hs_cos_wrapper_widget_1732794083696 > div.pt-banner-slider > div.pt-anim-banner-slide div.span12 > div#hs_cos_wrapper_widget_1732794083696 > div.pt-banner-slider > div.pt-anim-banner-slide | www.peloton.com/hubfs/banner-bg.png | 375.0 KiB | 103.3 KiB |
Facility Construction & Commissioning div.use-cases-list > div.use-case > div.use-case-inner > div.use-case-front | www.peloton.com/hubfs/drilling-completions.png | 77.8 KiB | 61.8 KiB |
breaking-the-data-1 div.slick-track > div.update-banner > div.update-banner-bg > img.desktop-img | /hs-fs/hubfs/breaking-the-data-1.png?width=1779&height=24... | 101.1 KiB | 52.9 KiB |
Asset Integrity Monitoring div.use-cases-list > div.use-case > div.use-case-inner > div.use-case-front | www.peloton.com/hubfs/usecase2.png | 68.7 KiB | 44.3 KiB |
These insights are also available in the Chrome DevTools Performance Panel - record a trace to view more detailed information.
Time to Interactive is the amount of time it takes for the page to become fully interactive. Learn more about the Time to Interactive metric.
Minifying JavaScript files can reduce payload sizes and script parse time. Learn how to minify JavaScript.
| URL | Transfer Size | Est Savings |
|---|---|---|
| /hubfs/hub_generated/template_assets/1/183226165104/17754... | 83.5 KiB | 42.7 KiB |
Reduce unused JavaScript and defer loading scripts until they are required to decrease bytes consumed by network activity. Learn how to reduce unused JavaScript.
| URL | Transfer Size | Est Savings |
|---|---|---|
| unpkg.com/@dotlottie/player-component@latest/dist/dotlottie-player.js | 495.5 KiB | 448.8 KiB |
| www.peloton.com/_hcms/forms/v2.js | 193.2 KiB | 112.3 KiB |
| www.googletagmanager.com/gtag/js?id=AW-16508021088&cx=c>m=4e6460 | 142.9 KiB | 105.1 KiB |
| www.googletagmanager.com/gtag/js?id=G-TZN35GWCZ2&cx=c>m=4e6460 | 160.6 KiB | 66.4 KiB |
| www.googletagmanager.com/gtm.js?id=GTM-WFZLP8J2 | 152.0 KiB | 61.9 KiB |
| www.googletagmanager.com/gtag/js?id=AW-16508021088 | 142.9 KiB | 55.7 KiB |
| /hubfs/hub_generated/template_assets/1/183226165104/17754... | 83.5 KiB | 34.9 KiB |
Consider reducing the time spent parsing, compiling, and executing JS. You may find delivering smaller JS payloads helps with this. Learn how to reduce Javascript execution time.
| URL | Total CPU Time | Script Evaluation | Script Parse |
|---|---|---|---|
| scripts.clarity.ms/0.8.60-beta/clarity.js | 503 ms | 372 ms | 3.3 ms |
| unpkg.com/@dotlottie/player-component@latest/dist/dotlottie-player.js | 422 ms | 349 ms | 0.0 ms |
| www.peloton.com/ | 417 ms | 52 ms | 65 ms |
| Unattributable | 324 ms | 8.3 ms | 0.0 ms |
| js.hs-analytics.net/analytics/1775593200000/21730018.js | 189 ms | 128 ms | 4.4 ms |
| www.googletagmanager.com/gtag/js?id=AW-16508021088 | 106 ms | 77 ms | 12 ms |
| www.googletagmanager.com/gtm.js?id=GTM-WFZLP8J2 | 93 ms | 77 ms | 14 ms |
| www.googletagmanager.com/gtag/js?id=G-TZN35GWCZ2&cx=c>m=4e6460 | 85 ms | 65 ms | 19 ms |
| /hubfs/hub_generated/template_assets/1/183226165104/17754... | 73 ms | 55 ms | 11 ms |
Consider reducing the time spent parsing, compiling and executing JS. You may find delivering smaller JS payloads helps with this. Learn how to minimize main-thread work
| Category | Time Spent |
|---|---|
| Script Evaluation | 1.6 s |
| Other | 460 ms |
| Style & Layout | 264 ms |
| Script Parsing & Compilation | 182 ms |
| Rendering | 109 ms |
| Garbage Collection | 73 ms |
| Parse HTML & CSS | 31 ms |
Large network payloads cost users real money and are highly correlated with long load times. Learn how to reduce payload sizes.
Set an explicit width and height on image elements to reduce layout shifts and improve CLS. Learn how to set image dimensions
| URL | |
|---|---|
platform-title div.container > div.banner_animation_box > div.box_title > img.hide-desktop-title | www.peloton.com/hubfs/platform-title.svg |
More information about the performance of your application. These numbers don't directly affect the Performance score.
These checks highlight opportunities to improve the accessibility of your web app. Automatic detection can only detect a subset of issues and does not guarantee the accessibility of your web app, so manual testing is also encouraged.
Low-contrast text is difficult or impossible for many users to read. Learn how to provide sufficient color contrast.
| Failing Elements |
|---|
Accept div#hs-eu-cookie-confirmation-buttons-area > div#hs-eu-confirmation-button-group > div#hs-eu-opt-in-buttons > button#hs-eu-confirmation-button |
REQUEST A DEMO div.mobile_header_primary_menu > div#hs_cos_wrapper_Header_Right > div.header-right-content > a.pt-btn |
LEARN MORE div.container > div.update-banner-row > div.update-banner-link > a |
USE CASES div.use-cases-row > div.use-cases-heading-wrap > div.use-cases-heading-left > div.use-case-subtitle |
MORE USE CASES div.container > div.use-cases-row > a.pb-more-btn > span |
Our Company div.two-column-tab-content > div.two-column-tab-content-row > div.two-column-tab-buttons > button.two-column-tab-btn |
FIND OUT MORE div.two-column-tab-content > div.two-column-tab-content-row > div#tab_1 > a.pt-btn |
FIND OUT MORE div.two-column-img-text-section > div.two-column-section-content > div.two-column-section-content-wrap > a.pt-btn |
These are opportunities to improve the legibility of your content.
Image display dimensions should match natural aspect ratio. Learn more about image aspect ratio.
| URL | Aspect Ratio (Displayed) | Aspect Ratio (Actual) | |
|---|---|---|---|
ourcompany_bg div#hs_cos_wrapper_widget_1733061624882 > div.two-column-tab > div.two-column-tab-image > img | /hs-fs/hubfs/ourcompany_bg.png?width=904&height=591&name=... | 675 x 516 (1.31) | 904 x 591 (1.53) |
Hydrocarbon Accounting Software for Oil & Gas | Peloton li.menu__item > a.submenu__link > span.sub-menu_bg > img | /hs-fs/hubfs/Group 1640.png?width=341&height=289&name=Gro... | 330 x 250 (1.32) | 341 x 289 (1.18) |
Production Operations Oversight li.menu__item > a.submenu__link > span.sub-menu_bg > img | /hs-fs/hubfs/Group 1638.png?width=341&height=282&name=Gro... | 330 x 250 (1.32) | 341 x 282 (1.21) |
Asset Integrity Monitoring li.menu__item > a.submenu__link > span.sub-menu_bg > img | /hs-fs/hubfs/Group 1639.png?width=341&height=289&name=Gro... | 330 x 250 (1.32) | 341 x 289 (1.18) |
GEOSPATIAL ASSET ANALYSIS li.menu__item > a.submenu__link > span.sub-menu_bg > img | /hs-fs/hubfs/Group 1639.png?width=341&height=289&name=Gro... | 330 x 250 (1.32) | 341 x 289 (1.18) |
Drilling & Completions Management li.menu__item > a.submenu__link > span.sub-menu_bg > img | /hs-fs/hubfs/Group 1640.png?width=341&height=289&name=Gro... | 330 x 250 (1.32) | 341 x 289 (1.18) |
HYDRAULIC FRAC DATA CENTRALIZATION li.menu__item > a.submenu__link > span.sub-menu_bg > img | /hs-fs/hubfs/Group 1638.png?width=341&height=282&name=Gro... | 330 x 250 (1.32) | 341 x 282 (1.21) |
Deprecated APIs will eventually be removed from the browser. Learn more about deprecated APIs.
| Deprecation / Warning | Source |
|---|---|
| AttributionReporting |
Errors logged to the console indicate unresolved problems. They can come from network request failures and other browser concerns. Learn more about this errors in console diagnostic audit
| Source | Description |
|---|---|
Failed to load resource: the server responded with a status of 404 () | |
TypeError: Cannot read properties of null (reading 'addEventListener')
at HTMLDocument.<anonymous> (https://21730018.fs1.hubspotusercontent-na1.net/hubfs/21730018/hub_generated/module_assets/1/183215645283/1775135981203/module_Header_Right.js:1:141) |
Source maps translate minified code to the original source code. This helps developers debug in production. In addition, Lighthouse is able to provide further insights. Consider deploying source maps to take advantage of these benefits. Learn more about source maps.
These checks ensure that your page is following basic search engine optimization advice. There are many additional factors Lighthouse does not score here that may affect your search ranking, including performance on Core Web Vitals. Learn more about Google Search Essentials.
Descriptive link text helps search engines understand your content. Learn how to make links more accessible.
| Link destination | Link Text |
|---|---|
| communications.peloton.com/2026-peloton-platforum?hsLang=en | LEARN MORE |
| /peloton?utm_source=starlink&utm_medium=banner&utm_campai... | LEARN MORE |
| www.peloton.com/products/well-data-lifecycle/peloton-innova?hsLang=en | LEARN MORE |
| www.peloton.com/renewables?hsLang=en | LEARN MORE |
Format your HTML in a way that enables crawlers to better understand your app’s content.
Send Feedback