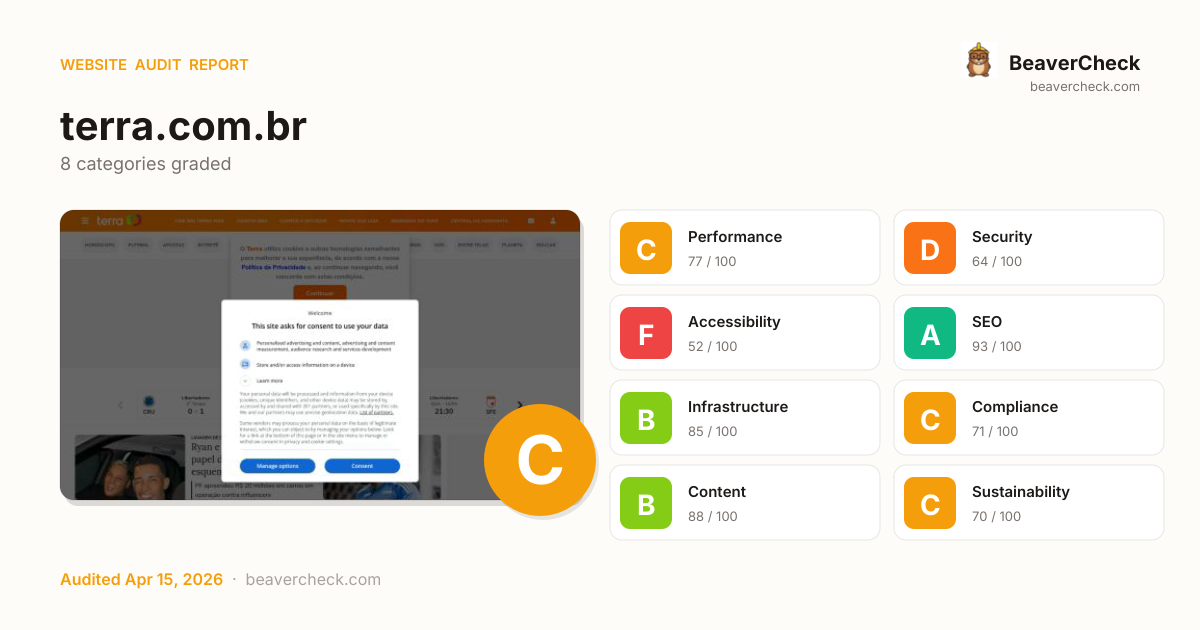
Mobile 375 × 812

Desktop 1440 × 900

Score: 72 / 100
Based on 8 categories, 0 sections
Decent speed, but optimizing further could improve engagement.
Several missing protections leave your users and data exposed.
Several issues make your site difficult for assistive technology users.
Well-optimized for search — your content is discoverable.
Solid infrastructure — fast server responses across the board.
Mostly compliant — a few items need attention.
Rich content metadata — your pages look great everywhere.
Reasonable footprint with room for optimization.
The overall score is a weighted average of individual category scores. Categories with more impact on user experience and security carry more weight.
Weights reflect general web best practices. Individual needs may differ.
Content-Security-Policy header is missing
Security gaps expose your site and users to attacks, eroding trust.
HSTS header is missing
Security gaps expose your site and users to attacks, eroding trust.
No Content-Security-Policy header found
Security gaps expose your site and users to attacks, eroding trust.
1 link(s) with no accessible text
Accessibility issues exclude users with disabilities — up to 15% of your potential audience.
No <main> landmark found
Accessibility issues exclude users with disabilities — up to 15% of your potential audience.
High impact, low effort — start here.
High impact, requires investment.
Small gains, minimal effort.
Nothing in this quadrant — good news.
Low impact, high effort — do last.
Nothing in this quadrant — good news.
[](https://beavercheck.com/results/dbc1a320-5223-4635-a4e6-7b7ea91466a1)<a href="https://beavercheck.com/results/dbc1a320-5223-4635-a4e6-7b7ea91466a1"><img src="https://beavercheck.com/badge?url=https%3A%2F%2Fterra.com.br" alt="BeaverCheck Score"></a>https://beavercheck.com/badge?url=https%3A%2F%2Fterra.com.brThis badge auto-updates with your latest scan result.
Your site performs reasonably well, but a few targeted fixes could meaningfully improve results. Accessibility issues exclude users who rely on assistive technology — an estimated 15% of your potential audience. Addressing the critical issues below would have the most immediate impact on your user trust.
BRL 810 investment → BRL 3.93/month returns + BRL 50,000,000 risk avoided
BRL 810
4h · 5 findings
BRL 3.93 /mo
~BRL 47 / year
BRL 50,000,000
if kept compliant
BRL 270 — in quick wins — start here for the fastest payback
Figures combine localized regulatory fine ceilings, search/conversion value priced against local CPC, and bandwidth waste estimates. Results depend on implementation quality and audience composition. Not legal or financial advice.
4.5 developer hours at R$180/hr
Based on Brazil rates (R$180/hr)
Start here for the best return on investment
BRL 4,166,671 / month at risk
~BRL 50,000,047 / year if left unfixed
BRL 50,000,000
+2 more
BRL 3.93 /mo
9577.4 MB/mo × 0.410 BRL/GB
Compliance figures represent the statutory maximum fine for the most severe triggered category, capped per regulation — not the sum of per-finding penalties. Based on published regulatory fine ranges. This is not legal advice.
Thanks for your feedback!
We'll use a cached audit if available, or offer to scan.
Industry-standard audits powered by Google Lighthouse.
Key metrics that affect user experience.
First Contentful Paint First Contentful Paint — how long until the browser renders the first piece of content. Under 1.8s is good.
3.02 s
Largest Contentful Paint Largest Contentful Paint — how long until the largest visible element loads. Under 2.5s is good.
0 ms
Total Blocking Time Total Blocking Time — total time the main thread was blocked, preventing user input. Under 200ms is good.
0 ms
Cumulative Layout Shift Cumulative Layout Shift — measures visual stability. How much the page layout shifts during loading. Under 0.1 is good.
0.091
Speed Index Speed Index — how quickly content is visually displayed during load. Under 3.4s is good.
7.77 s
Time to Interactive Time to Interactive — how long until the page is fully interactive and responds to user input. Under 3.8s is good.
0 ms
Audit breakdown by category with detailed findings.
Remove large, duplicate JavaScript modules from bundles to reduce unnecessary bytes consumed by network activity.
Performance issues directly impact user engagement and conversion rates.
Polyfills and transforms enable older browsers to use new JavaScript features. However, many aren't necessary for modern browsers. Consider modifying your JavaScript build process to not transpile Baseline features, unless you know you must support older browsers. Learn why most sites can deploy ES6+ code without transpiling
Shipping ES5 transpiled code to modern browsers wastes bytes — every user with an evergreen browser pays for compatibility you don't need.
Most users today run browsers that natively support ES6+, async/await, optional chaining, and the rest of modern JavaScript. Transpiling to ES5 'just in case' adds 20-40% to your bundle for no benefit. Configure your build to target a modern browserslist, or ship a differential bundle pair (modern + legacy) with the module/nomodule pattern.
Source: Google web.dev / Lighthouse
3rd party code can significantly impact load performance. Reduce and defer loading of 3rd party code to prioritize your page's content.
Performance issues directly impact user engagement and conversion rates.
A long cache lifetime can speed up repeat visits to your page. Learn more about caching.
Performance issues directly impact user engagement and conversion rates.
Your first network request is the most important. Reduce its latency by avoiding redirects, ensuring a fast server response, and enabling text compression.
Performance issues directly impact user engagement and conversion rates.
Consider setting font-display to swap or optional to ensure text is consistently visible. swap can be further optimized to mitigate layout shifts with font metric overrides.
Performance issues directly impact user engagement and conversion rates.
| URL | Est Savings |
|---|---|
| /s/opensans/v40/memvYaGs126MiZpBA-UvWbX2vVnXBbObj2OVTS-mu... | 25 ms |
A forced reflow occurs when JavaScript queries geometric properties (such as offsetWidth) after styles have been invalidated by a change to the DOM state. This can result in poor performance. Learn more about forced reflows and possible mitigations.
Performance issues directly impact user engagement and conversion rates.
Reducing the download time of images can improve the perceived load time of the page and LCP. Learn more about optimizing image size
Performance issues directly impact user engagement and conversion rates.
| URL | Resource Size | Est Savings | |
|---|---|---|---|
Acidente com carro da Band Minas deixa um morto e um ferido em estado grave div#card-d5b48dcd39aeb347fa02cd1d61d66281ehdwosss > div.card-news__image > a.card-news__url > img | /image/fget/cf/1420/780/0/0/640/336/images.terra.com/2026... | 41.1 KiB | 6.1 KiB |
Requests are blocking the page's initial render, which may delay LCP. Deferring or inlining can move these network requests out of the critical path.
Performance issues directly impact user engagement and conversion rates.
These insights are also available in the Chrome DevTools Performance Panel - record a trace to view more detailed information.
Time to Interactive is the amount of time it takes for the page to become fully interactive. Learn more about the Time to Interactive metric.
Performance issues directly impact user engagement and conversion rates.
Redirects introduce additional delays before the page can be loaded. Learn how to avoid page redirects.
Performance issues directly impact user engagement and conversion rates.
The maximum potential First Input Delay that your users could experience is the duration of the longest task. Learn more about the Maximum Potential First Input Delay metric.
Performance issues directly impact user engagement and conversion rates.
Minifying CSS files can reduce network payload sizes. Learn how to minify CSS.
Performance issues directly impact user engagement and conversion rates.
Minifying JavaScript files can reduce payload sizes and script parse time. Learn how to minify JavaScript.
Performance issues directly impact user engagement and conversion rates.
Reduce unused rules from stylesheets and defer CSS not used for above-the-fold content to decrease bytes consumed by network activity. Learn how to reduce unused CSS.
Performance issues directly impact user engagement and conversion rates.
Reduce unused JavaScript and defer loading scripts until they are required to decrease bytes consumed by network activity. Learn how to reduce unused JavaScript.
Multi-megabyte JavaScript bundles delay every interactive feature on the page.
This is the Lighthouse audit fired when too much JS is shipped relative to what executes. The fix isn't a config flag — it requires bundle analysis (webpack-bundle-analyzer, rollup-plugin-visualizer), splitting routes into chunks, lazy-loading off-screen components, and removing unused dependencies. Fundamentally different from minification: minifying reduces byte count, this reduces what's downloaded at all.
Source: Google web.dev / Lighthouse
Lists the longest tasks on the main thread, useful for identifying worst contributors to input delay. Learn how to avoid long main-thread tasks
Performance issues directly impact user engagement and conversion rates.
Many navigations are performed by going back to a previous page, or forwards again. The back/forward cache (bfcache) can speed up these return navigations. Learn more about the bfcache
Performance issues directly impact user engagement and conversion rates.
| Failure reason | Failure type |
|---|---|
| Pages with WebSocket cannot enter back/forward cache. | Pending browser support |
Large network payloads cost users real money and are highly correlated with long load times. Learn how to reduce payload sizes.
Performance issues directly impact user engagement and conversion rates.
Consider reducing the time spent parsing, compiling, and executing JS. You may find delivering smaller JS payloads helps with this. Learn how to reduce Javascript execution time.
Performance issues directly impact user engagement and conversion rates.
Consider reducing the time spent parsing, compiling and executing JS. You may find delivering smaller JS payloads helps with this. Learn how to minimize main-thread work
Performance issues directly impact user engagement and conversion rates.
| Category | Time Spent |
|---|---|
| Script Evaluation | 11.0 s |
| Other | 4.3 s |
| Style & Layout | 1.5 s |
| Script Parsing & Compilation | 1.3 s |
| Rendering | 826 ms |
| Parse HTML & CSS | 421 ms |
| Garbage Collection | 378 ms |
Set an explicit width and height on image elements to reduce layout shifts and improve CLS. Learn how to set image dimensions
Performance issues directly impact user engagement and conversion rates.
div#app-t360-editorial-apps > div.card-app-small-container > div#app-1756310 > img div#app-t360-editorial-apps > div.card-app-small-container > div#app-1756310 > img |
More information about the performance of your application. These numbers don't directly affect the Performance score.
These checks highlight opportunities to improve the accessibility of your web app. Automatic detection can only detect a subset of issues and does not guarantee the accessibility of your web app, so manual testing is also encouraged.
Low-contrast text is difficult or impossible for many users to read. Learn how to provide sufficient color contrast.
Performance issues directly impact user engagement and conversion rates.
| Failing Elements |
|---|
Terra div.push-notification--box-middle > div.push-notification--text-container > p.push-notification--message > b |
Continuar div.navbar-modules-notifications > dialog.t360-notification-bar > div.push-notification--button-container > button.push-notification--button |
PUBLICIDADE div#header-full-ad-container > div#header-full-ad--wrapper > div#header-full-ad > span.table-ad__full--label |
2° Tempo a > div.zaz-app-t360-ticker--match > div.zaz-app-t360-ticker--match--info > div.zaz-app-t360-ticker--match--info--date |
Exibir mais div#zaz-app-t360-ticker > div.zaz-app-t360-ticker--background > div#zaz-app-t360-ticker--container > button.zaz-app-t360-ticker--veja-mais |
PUBLICIDADE div#table-editorial-table > div.table-range-grid-step > div.card > div.card-ad__title |
PUBLICIDADE div#table-editorial-table > div#t360-subject-modules-table > div.card > div.card-ad__title |
Capricórnio ul.app-horoscope__mosaic--list > li.app-horoscope__mosaic--list__item > button.app-horoscope__mosaic--list__item-wrapper > div.icon-24 |
PUBLICIDADE div#table-editorial-table > div#app-t360-editorial-apps > div.card > div.card-ad__title |
Learn more div.fc-dialog-content > div.fc-dialog-scrollable-content > button.fc-faq-header > span.fc-faq-label |
These are opportunities to improve the legibility of your content.
Link text (and alternate text for images, when used as links) that is discernible, unique, and focusable improves the navigation experience for screen reader users. Learn how to make links accessible.
Performance issues directly impact user engagement and conversion rates.
| Failing Elements |
|---|
div#app-1649733 > div.app-horoscope__mosaic > header.app-horoscope__mosaic--header > a.terra-astral div#app-1649733 > div.app-horoscope__mosaic > header.app-horoscope__mosaic--header > a.terra-astral |
Including a skip link can help users skip to the main content to save time. Learn more about skip links.
Performance issues directly impact user engagement and conversion rates.
| Failing Elements |
|---|
Ir ao conteúdo body.pt-BR > ul.accessibility-block > li > a |
These are opportunities to improve the semantics of the controls in your application. This may enhance the experience for users of assistive technology, like a screen reader.
Screen readers require list items (`<li>`) to be contained within a parent `<ul>`, `<ol>` or `<menu>` to be announced properly. Learn more about proper list structure.
Performance issues directly impact user engagement and conversion rates.
| Failing Elements |
|---|
Série A div.app-teams > header.app-teams__header > nav.app-teams__header__menu > li.app-teams__header__item |
Série B div.app-teams > header.app-teams__header > nav.app-teams__header__menu > li.app-teams__header__item |
These are opportunities to improve the experience of reading tabular or list data using assistive technology, like a screen reader.
A value greater than 0 implies an explicit navigation ordering. Although technically valid, this often creates frustrating experiences for users who rely on assistive technologies. Learn more about the `tabindex` attribute.
Performance issues directly impact user engagement and conversion rates.
| Failing Elements |
|---|
Ir ao conteúdo body.pt-BR > ul.accessibility-block > li > a |
HORÓSCOPO
FUTEBOL
APOSTAS
ENTRETÊ
NOTÍCIAS
VOCÊ
MOBILIDADE
DEGUSTA
BYTE
DINHEIR… body.pt-BR > div.open-menu-t360--wrapper > div.open-menu-t360 > nav |
These are opportunities to improve keyboard navigation in your application.
Deprecated APIs will eventually be removed from the browser. Learn more about deprecated APIs.
Performance issues directly impact user engagement and conversion rates.
| Deprecation / Warning | Source |
|---|---|
| Topics | s1.trrsf.com/update-1769694927/fe/zaz-3rd/prebid/prebid.js line 12, col 99572 |
Errors logged to the console indicate unresolved problems. They can come from network request failures and other browser concerns. Learn more about this errors in console diagnostic audit
Performance issues directly impact user engagement and conversion rates.
| Source | Description |
|---|---|
Failed to load resource: the server responded with a status of 451 () | |
www.terra.com.br/ line 2246, col 7311 | TypeError: Cannot read properties of undefined (reading 'md5')
at https://www.terra.com.br/:2247:7312 |
Source maps translate minified code to the original source code. This helps developers debug in production. In addition, Lighthouse is able to provide further insights. Consider deploying source maps to take advantage of these benefits. Learn more about source maps.
Performance issues directly impact user engagement and conversion rates.
These checks ensure that your page is following basic search engine optimization advice. There are many additional factors Lighthouse does not score here that may affect your search ranking, including performance on Core Web Vitals. Learn more about Google Search Essentials.
Industry-standard audits powered by Google Lighthouse. — Desktop
Key metrics that affect user experience. — Desktop
First Contentful Paint First Contentful Paint — how long until the browser renders the first piece of content. Under 1.8s is good.
1.22 s
Largest Contentful Paint Largest Contentful Paint — how long until the largest visible element loads. Under 2.5s is good.
1.46 s
Total Blocking Time Total Blocking Time — total time the main thread was blocked, preventing user input. Under 200ms is good.
679 ms
Cumulative Layout Shift Cumulative Layout Shift — measures visual stability. How much the page layout shifts during loading. Under 0.1 is good.
0.012
Speed Index Speed Index — how quickly content is visually displayed during load. Under 3.4s is good.
3.42 s
Time to Interactive Time to Interactive — how long until the page is fully interactive and responds to user input. Under 3.8s is good.
5.64 s
Audit breakdown by category with detailed findings.
Remove large, duplicate JavaScript modules from bundles to reduce unnecessary bytes consumed by network activity.
Performance issues directly impact user engagement and conversion rates.
Polyfills and transforms enable older browsers to use new JavaScript features. However, many aren't necessary for modern browsers. Consider modifying your JavaScript build process to not transpile Baseline features, unless you know you must support older browsers. Learn why most sites can deploy ES6+ code without transpiling
Shipping ES5 transpiled code to modern browsers wastes bytes — every user with an evergreen browser pays for compatibility you don't need.
Most users today run browsers that natively support ES6+, async/await, optional chaining, and the rest of modern JavaScript. Transpiling to ES5 'just in case' adds 20-40% to your bundle for no benefit. Configure your build to target a modern browserslist, or ship a differential bundle pair (modern + legacy) with the module/nomodule pattern.
Source: Google web.dev / Lighthouse
3rd party code can significantly impact load performance. Reduce and defer loading of 3rd party code to prioritize your page's content.
Performance issues directly impact user engagement and conversion rates.
Your first network request is the most important. Reduce its latency by avoiding redirects, ensuring a fast server response, and enabling text compression.
Performance issues directly impact user engagement and conversion rates.
A forced reflow occurs when JavaScript queries geometric properties (such as offsetWidth) after styles have been invalidated by a change to the DOM state. This can result in poor performance. Learn more about forced reflows and possible mitigations.
Performance issues directly impact user engagement and conversion rates.
Optimize LCP by making the LCP image discoverable from the HTML immediately, and avoiding lazy-loading
Performance issues directly impact user engagement and conversion rates.
Avoid chaining critical requests by reducing the length of chains, reducing the download size of resources, or deferring the download of unnecessary resources to improve page load.
Performance issues directly impact user engagement and conversion rates.
Requests are blocking the page's initial render, which may delay LCP. Deferring or inlining can move these network requests out of the critical path.
Performance issues directly impact user engagement and conversion rates.
A long cache lifetime can speed up repeat visits to your page. Learn more about caching.
Performance issues directly impact user engagement and conversion rates.
Consider setting font-display to swap or optional to ensure text is consistently visible. swap can be further optimized to mitigate layout shifts with font metric overrides.
Performance issues directly impact user engagement and conversion rates.
| URL | Est Savings |
|---|---|
| /s/opensans/v40/memvYaGs126MiZpBA-UvWbX2vVnXBbObj2OVTS-mu... | 10 ms |
Reducing the download time of images can improve the perceived load time of the page and LCP. Learn more about optimizing image size
Performance issues directly impact user engagement and conversion rates.
| URL | Resource Size | Est Savings | |
|---|---|---|---|
div#app-t360-editorial-apps > div.card-app-small-container > div#app-1756310 > img div#app-t360-editorial-apps > div.card-app-small-container > div#app-1756310 > img | s1.trrsf.com/fe/zaz-app-financial/_img/loader.png | 25.9 KiB | 10.9 KiB |
These insights are also available in the Chrome DevTools Performance Panel - record a trace to view more detailed information.
Redirects introduce additional delays before the page can be loaded. Learn how to avoid page redirects.
Performance issues directly impact user engagement and conversion rates.
| URL | Time Spent |
|---|---|
| terra.com.br/ | 492 ms |
| www.terra.com.br/ | 0.0 ms |
Keep the server response time for the main document short because all other requests depend on it. Learn more about the Time to First Byte metric.
Performance issues directly impact user engagement and conversion rates.
| URL | Time Spent |
|---|---|
| www.terra.com.br/ | 785 ms |
Time to Interactive is the amount of time it takes for the page to become fully interactive. Learn more about the Time to Interactive metric.
Performance issues directly impact user engagement and conversion rates.
The maximum potential First Input Delay that your users could experience is the duration of the longest task. Learn more about the Maximum Potential First Input Delay metric.
Performance issues directly impact user engagement and conversion rates.
Reduce unused JavaScript and defer loading scripts until they are required to decrease bytes consumed by network activity. Learn how to reduce unused JavaScript.
Multi-megabyte JavaScript bundles delay every interactive feature on the page.
This is the Lighthouse audit fired when too much JS is shipped relative to what executes. The fix isn't a config flag — it requires bundle analysis (webpack-bundle-analyzer, rollup-plugin-visualizer), splitting routes into chunks, lazy-loading off-screen components, and removing unused dependencies. Fundamentally different from minification: minifying reduces byte count, this reduces what's downloaded at all.
Source: Google web.dev / Lighthouse
Consider reducing the time spent parsing, compiling, and executing JS. You may find delivering smaller JS payloads helps with this. Learn how to reduce Javascript execution time.
Performance issues directly impact user engagement and conversion rates.
Consider reducing the time spent parsing, compiling and executing JS. You may find delivering smaller JS payloads helps with this. Learn how to minimize main-thread work
Performance issues directly impact user engagement and conversion rates.
| Category | Time Spent |
|---|---|
| Script Evaluation | 3.0 s |
| Other | 1.0 s |
| Style & Layout | 400 ms |
| Script Parsing & Compilation | 317 ms |
| Rendering | 180 ms |
| Parse HTML & CSS | 107 ms |
| Garbage Collection | 75 ms |
Many navigations are performed by going back to a previous page, or forwards again. The back/forward cache (bfcache) can speed up these return navigations. Learn more about the bfcache
Performance issues directly impact user engagement and conversion rates.
| Failure reason | Failure type |
|---|---|
| Pages with WebSocket cannot enter back/forward cache. | Pending browser support |
Minifying JavaScript files can reduce payload sizes and script parse time. Learn how to minify JavaScript.
Performance issues directly impact user engagement and conversion rates.
| URL | Transfer Size | Est Savings |
|---|---|---|
| launchpad.privacymanager.io/latest/launchpad.bundle.js | 45.0 KiB | 14.2 KiB |
Reduce unused rules from stylesheets and defer CSS not used for above-the-fold content to decrease bytes consumed by network activity. Learn how to reduce unused CSS.
Performance issues directly impact user engagement and conversion rates.
| URL | Transfer Size | Est Savings |
|---|---|---|
| .fc-consent-root .fc-dialog-container.fc-fullscreen { height: 100% !important; … } … | 16.2 KiB | 14.1 KiB |
| s1.trrsf.com/update-1761768909/fe/zaz-app-player/_css/theme-default.min.css | 13.0 KiB | 13.0 KiB |
Large network payloads cost users real money and are highly correlated with long load times. Learn how to reduce payload sizes.
Performance issues directly impact user engagement and conversion rates.
Set an explicit width and height on image elements to reduce layout shifts and improve CLS. Learn how to set image dimensions
Performance issues directly impact user engagement and conversion rates.
| URL | |
|---|---|
div#app-t360-editorial-apps > div.card-app-small-container > div#app-1756310 > img div#app-t360-editorial-apps > div.card-app-small-container > div#app-1756310 > img | s1.trrsf.com/fe/zaz-app-financial/_img/loader.png |
More information about the performance of your application. These numbers don't directly affect the Performance score.
These checks highlight opportunities to improve the accessibility of your web app. Automatic detection can only detect a subset of issues and does not guarantee the accessibility of your web app, so manual testing is also encouraged.
Low-contrast text is difficult or impossible for many users to read. Learn how to provide sufficient color contrast.
Performance issues directly impact user engagement and conversion rates.
| Failing Elements |
|---|
Terra div.push-notification--box-middle > div.push-notification--text-container > p.push-notification--message > b |
Continuar div.navbar-modules-notifications > dialog.t360-notification-bar > div.push-notification--button-container > button.push-notification--button |
PUBLICIDADE div#header-full-ad-container > div#header-full-ad--wrapper > div#header-full-ad > span.table-ad__full--label |
2° Tempo a > div.zaz-app-t360-ticker--match > div.zaz-app-t360-ticker--match--info > div.zaz-app-t360-ticker--match--info--date |
QUA - 15/04 a > div.zaz-app-t360-ticker--match > div.zaz-app-t360-ticker--match--info > div.zaz-app-t360-ticker--match--info--date |
PUBLICIDADE div#table-editorial-table > div.table-range-grid-step > div.card > div.card-ad__title |
PUBLICIDADE div#table-editorial-table > div#app-t360-editorial-apps > div.card > div.card-ad__title |
Learn more div.fc-dialog-content > div.fc-dialog-scrollable-content > button.fc-faq-header > span.fc-faq-label |
List of partners. div.fc-dialog-scrollable-content > div.fc-footer > p > a.fc-vendors-list-dialog |
These are opportunities to improve the legibility of your content.
Link text (and alternate text for images, when used as links) that is discernible, unique, and focusable improves the navigation experience for screen reader users. Learn how to make links accessible.
Performance issues directly impact user engagement and conversion rates.
| Failing Elements |
|---|
div#app-1649733 > div.app-horoscope__mosaic > header.app-horoscope__mosaic--header > a.terra-astral div#app-1649733 > div.app-horoscope__mosaic > header.app-horoscope__mosaic--header > a.terra-astral |
Including a skip link can help users skip to the main content to save time. Learn more about skip links.
Performance issues directly impact user engagement and conversion rates.
| Failing Elements |
|---|
Ir ao conteúdo body.pt-BR > ul.accessibility-block > li > a |
These are opportunities to improve the semantics of the controls in your application. This may enhance the experience for users of assistive technology, like a screen reader.
Screen readers require list items (`<li>`) to be contained within a parent `<ul>`, `<ol>` or `<menu>` to be announced properly. Learn more about proper list structure.
Performance issues directly impact user engagement and conversion rates.
| Failing Elements |
|---|
Série A div.app-teams > header.app-teams__header > nav.app-teams__header__menu > li.app-teams__header__item |
Série B div.app-teams > header.app-teams__header > nav.app-teams__header__menu > li.app-teams__header__item |
These are opportunities to improve the experience of reading tabular or list data using assistive technology, like a screen reader.
A value greater than 0 implies an explicit navigation ordering. Although technically valid, this often creates frustrating experiences for users who rely on assistive technologies. Learn more about the `tabindex` attribute.
Performance issues directly impact user engagement and conversion rates.
| Failing Elements |
|---|
Ir ao conteúdo body.pt-BR > ul.accessibility-block > li > a |
HORÓSCOPO
FUTEBOL
APOSTAS
ENTRETÊ
NOTÍCIAS
VOCÊ
MOBILIDADE
DEGUSTA
BYTE
DINHEIR… body.pt-BR > div.open-menu-t360--wrapper > div.open-menu-t360 > nav |
These are opportunities to improve keyboard navigation in your application.
Deprecated APIs will eventually be removed from the browser. Learn more about deprecated APIs.
Performance issues directly impact user engagement and conversion rates.
| Deprecation / Warning | Source |
|---|---|
| Topics | s1.trrsf.com/update-1769694927/fe/zaz-3rd/prebid/prebid.js line 12, col 99572 |
Errors logged to the console indicate unresolved problems. They can come from network request failures and other browser concerns. Learn more about this errors in console diagnostic audit
Performance issues directly impact user engagement and conversion rates.
| Source | Description |
|---|---|
Failed to load resource: the server responded with a status of 451 () | |
www.terra.com.br/ line 2098, col 7311 | TypeError: Cannot read properties of undefined (reading 'md5')
at https://www.terra.com.br/:2099:7312 |
Source maps translate minified code to the original source code. This helps developers debug in production. In addition, Lighthouse is able to provide further insights. Consider deploying source maps to take advantage of these benefits. Learn more about source maps.
Performance issues directly impact user engagement and conversion rates.
These checks ensure that your page is following basic search engine optimization advice. There are many additional factors Lighthouse does not score here that may affect your search ranking, including performance on Core Web Vitals. Learn more about Google Search Essentials.
Send Feedback