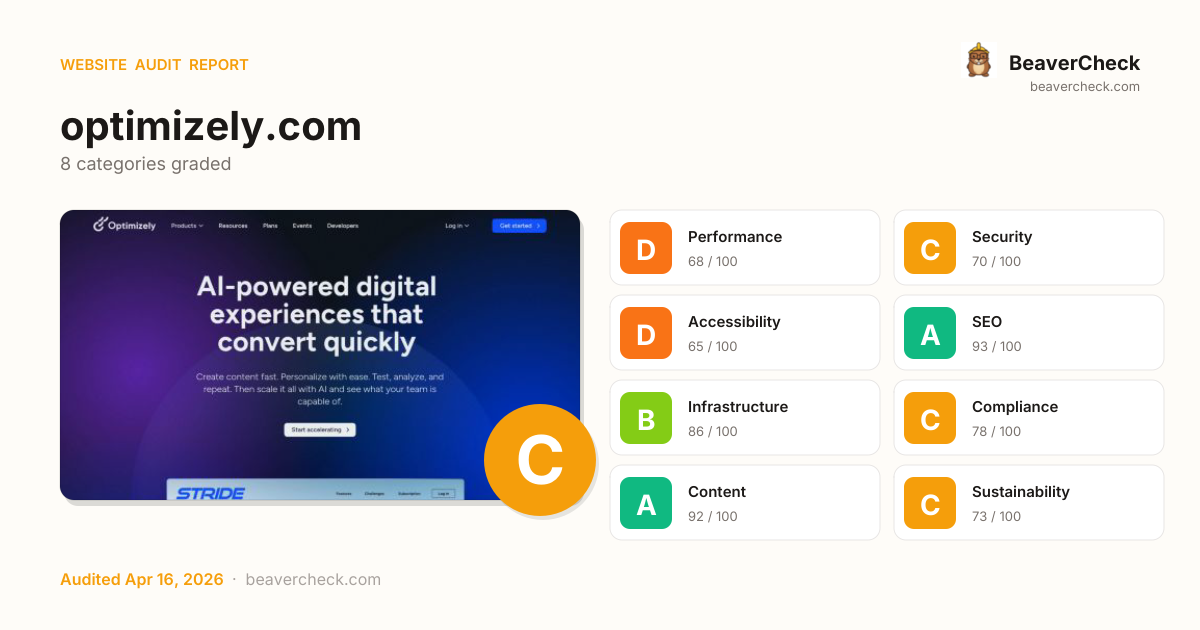
Mobile 375 × 812

Desktop 1440 × 900

Score: 74 / 100
Based on 8 categories, 0 sections
Room to improve — your 9.5s load time is above Google's 2.5s 'Good' threshold.
Good foundation, but a few gaps could be exploited.
Several issues make your site difficult for assistive technology users.
Well-optimized for search — your content is discoverable.
Solid infrastructure — fast server responses across the board.
Mostly compliant — a few items need attention.
Rich content metadata — your pages look great everywhere.
Reasonable footprint with room for optimization.
The overall score is a weighted average of individual category scores. Categories with more impact on user experience and security carry more weight.
Weights reflect general web best practices. Individual needs may differ.
Content-Security-Policy header is missing
Security gaps expose your site and users to attacks, eroding trust.
HSTS header is missing
Security gaps expose your site and users to attacks, eroding trust.
No Content-Security-Policy header found
Security gaps expose your site and users to attacks, eroding trust.
1 control(s) without accessible label
Accessibility issues exclude users with disabilities — up to 15% of your potential audience.
is missing width/height — may cause layout shift
Performance issues directly impact user engagement and conversion rates.
High impact, low effort — start here.
High impact, requires investment.
Small gains, minimal effort.
Nothing in this quadrant — good news.
Low impact, high effort — do last.
Nothing in this quadrant — good news.
[](https://beavercheck.com/results/e0841836-63de-40f5-b49a-1c087fa6c833)<a href="https://beavercheck.com/results/e0841836-63de-40f5-b49a-1c087fa6c833"><img src="https://beavercheck.com/badge?url=https%3A%2F%2Foptimizely.com" alt="BeaverCheck Score"></a>https://beavercheck.com/badge?url=https%3A%2F%2Foptimizely.comThis badge auto-updates with your latest scan result.
Your site performs reasonably well, but a few targeted fixes could meaningfully improve results. Your LCP of 9.5s exceeds Google's 2.5s 'Good' threshold and the 1 performance issue below directly contributes to it. Addressing the critical issues below would have the most immediate impact on your user trust.
7 barrier(s) likely increasing bounce by ~29%.
Page takes 9.5s to load
+12% bounceUsers abandon at ~3s — you're 7.0s over the 2.5s threshold
Fix: Optimize render-blocking resources, preload the hero image, and compress images
Page feels frozen for 6.9s
+5% bounceClicks on the primary CTA are ignored while JavaScript runs
Fix: Break up long tasks; defer non-critical JavaScript to post-hydration
No HSTS header
+1% bounceReturning visitors are briefly exposed to downgrade attacks on first request
Fix: Set Strict-Transport-Security: max-age=31536000; includeSubDomains
No Content-Security-Policy header
+1% bounceHigher XSS blast radius — one compromised script can exfiltrate the checkout form
Fix: Ship a reporting-only CSP first, then enforce once violations are clean
1 form field(s) without a label
+2% bounceScreen readers skip unlabeled fields; autofill can't identify them; checkout abandonment spikes
Fix: Associate every input with a visible <label for="…">; add autocomplete attributes
Content is hard to read
+2% bounceGraduate-level reading difficulty — limits the addressable audience for product or blog pages
Fix: Shorten sentences; replace jargon with plain language; target Flesch ease ≥60
2 broken link(s) on the page
+3% bounceClicks land on 404s — trust drops and the session often ends
Fix: Fix or remove the broken destinations surfaced on the Content tab
Preliminary CRO audit — each barrier links to the tab with detailed analysis.
SEK 4,250 investment → SEK 49,658/month returns + EUR 120,500,000 risk avoided
SEK 4,250
5h · 5 findings
SEK 49,658 /mo
~SEK 595,892 / year
EUR 120,500,000
if kept compliant
SEK 1,275 — in quick wins — start here for the fastest payback
Figures combine localized regulatory fine ceilings, search/conversion value priced against local CPC, and bandwidth waste estimates. Results depend on implementation quality and audience composition. Not legal or financial advice.
5.0 developer hours at kr850/hr
Based on Sweden rates (kr850/hr)
Start here for the best return on investment
SEK 10,041,676 / month at risk
~SEK 120,500,107 / year if left unfixed
€120,500,000
+7 more
SEK 8.88 /mo
10540.6 MB/mo × 0.842 SEK/GB
Compliance figures represent the statutory maximum fine for the most severe triggered category, capped per regulation — not the sum of per-finding penalties. Based on published regulatory fine ranges. This is not legal advice.
Unique monthly visitors from your analytics
Purchases, signups, or key actions
Optional — for revenue estimation
more engaged visitors from reduced bounce
Fix 4 critical issues to capture this value
Based on Google/Deloitte research ("Milliseconds Make Millions") showing a ~7% bounce rate increase per additional second of LCP above the 2.5s "Good" threshold.
Your site's LCP: → estimated after fixes.
These are estimates based on industry research — actual results vary
Your data stays in your browser — nothing is sent to our servers
Thanks for your feedback!
We'll use a cached audit if available, or offer to scan.
Industry-standard audits powered by Google Lighthouse.
Key metrics that affect user experience.
First Contentful Paint First Contentful Paint — how long until the browser renders the first piece of content. Under 1.8s is good.
6.01 s
Largest Contentful Paint Largest Contentful Paint — how long until the largest visible element loads. Under 2.5s is good.
9.51 s
Total Blocking Time Total Blocking Time — total time the main thread was blocked, preventing user input. Under 200ms is good.
6.92 s
Cumulative Layout Shift Cumulative Layout Shift — measures visual stability. How much the page layout shifts during loading. Under 0.1 is good.
0.000
Speed Index Speed Index — how quickly content is visually displayed during load. Under 3.4s is good.
14.40 s
Time to Interactive Time to Interactive — how long until the page is fully interactive and responds to user input. Under 3.8s is good.
33.60 s
Audit breakdown by category with detailed findings.
Remove large, duplicate JavaScript modules from bundles to reduce unnecessary bytes consumed by network activity.
Performance issues directly impact user engagement and conversion rates.
Polyfills and transforms enable older browsers to use new JavaScript features. However, many aren't necessary for modern browsers. Consider modifying your JavaScript build process to not transpile Baseline features, unless you know you must support older browsers. Learn why most sites can deploy ES6+ code without transpiling
Shipping ES5 transpiled code to modern browsers wastes bytes — every user with an evergreen browser pays for compatibility you don't need.
Most users today run browsers that natively support ES6+, async/await, optional chaining, and the rest of modern JavaScript. Transpiling to ES5 'just in case' adds 20-40% to your bundle for no benefit. Configure your build to target a modern browserslist, or ship a differential bundle pair (modern + legacy) with the module/nomodule pattern.
Source: Google web.dev / Lighthouse
3rd party code can significantly impact load performance. Reduce and defer loading of 3rd party code to prioritize your page's content.
Performance issues directly impact user engagement and conversion rates.
A long cache lifetime can speed up repeat visits to your page. Learn more about caching.
Performance issues directly impact user engagement and conversion rates.
Your first network request is the most important. Reduce its latency by avoiding redirects, ensuring a fast server response, and enabling text compression.
Performance issues directly impact user engagement and conversion rates.
A forced reflow occurs when JavaScript queries geometric properties (such as offsetWidth) after styles have been invalidated by a change to the DOM state. This can result in poor performance. Learn more about forced reflows and possible mitigations.
Performance issues directly impact user engagement and conversion rates.
Optimize LCP by making the LCP image discoverable from the HTML immediately, and avoiding lazy-loading
Performance issues directly impact user engagement and conversion rates.
Avoid chaining critical requests by reducing the length of chains, reducing the download size of resources, or deferring the download of unnecessary resources to improve page load.
Performance issues directly impact user engagement and conversion rates.
Requests are blocking the page's initial render, which may delay LCP. Deferring or inlining can move these network requests out of the critical path.
Performance issues directly impact user engagement and conversion rates.
Reducing the download time of images can improve the perceived load time of the page and LCP. Learn more about optimizing image size
Performance issues directly impact user engagement and conversion rates.
| URL | Resource Size | Est Savings | |
|---|---|---|---|
graphical user interface, text, application, chat or text message div.w-full > div.flex > div.relative > img.absolute | /contentassets/90461ceea0184877b2c559273cd1da58/opal-ai-h... | 44.8 KiB | 40.5 KiB |
graphical user interface, text, application div.grid > div.col-span-12 > div.relative > img.absolute | /contentassets/90461ceea0184877b2c559273cd1da58/content-t... | 32.9 KiB | 18.0 KiB |
graphical user interface div.grid > div.col-span-12 > div.relative > img.absolute | /contentassets/90461ceea0184877b2c559273cd1da58/commerce-... | 21.3 KiB | 11.6 KiB |
div#skipNav > main.react-module > div.home-hero > ::after div#skipNav > main.react-module > div.home-hero > ::after | www.optimizely.com/assets/noise-7867172c.png | 22.1 KiB | 11.4 KiB |
These insights are also available in the Chrome DevTools Performance Panel - record a trace to view more detailed information.
Time to Interactive is the amount of time it takes for the page to become fully interactive. Learn more about the Time to Interactive metric.
Performance issues directly impact user engagement and conversion rates.
The maximum potential First Input Delay that your users could experience is the duration of the longest task. Learn more about the Maximum Potential First Input Delay metric.
Performance issues directly impact user engagement and conversion rates.
Redirects introduce additional delays before the page can be loaded. Learn how to avoid page redirects.
Performance issues directly impact user engagement and conversion rates.
| URL | Time Spent |
|---|---|
| optimizely.com/ | 762 ms |
| www.optimizely.com/ | 0.0 ms |
Reduce unused rules from stylesheets and defer CSS not used for above-the-fold content to decrease bytes consumed by network activity. Learn how to reduce unused CSS.
Performance issues directly impact user engagement and conversion rates.
| URL | Transfer Size | Est Savings |
|---|---|---|
| www.optimizely.com/assets/entry-client-1dd1561b.css | 39.6 KiB | 35.8 KiB |
| www.optimizely.com/assets/custom-form-0a4bb47a.css | 13.1 KiB | 11.8 KiB |
Reduce unused JavaScript and defer loading scripts until they are required to decrease bytes consumed by network activity. Learn how to reduce unused JavaScript.
Multi-megabyte JavaScript bundles delay every interactive feature on the page.
This is the Lighthouse audit fired when too much JS is shipped relative to what executes. The fix isn't a config flag — it requires bundle analysis (webpack-bundle-analyzer, rollup-plugin-visualizer), splitting routes into chunks, lazy-loading off-screen components, and removing unused dependencies. Fundamentally different from minification: minifying reduces byte count, this reduces what's downloaded at all.
Source: Google web.dev / Lighthouse
| URL | Transfer Size | Est Savings |
|---|---|---|
| www.gstatic.com/recaptcha/releases/gTpTIWhbKpxADzTzkcabhXN4/recaptcha__en.js | 361.8 KiB | 155.0 KiB |
| www.optimizely.com/Util/EPiServer.Forms.Samples/jquery-ui/jquery-ui.min.js | 67.5 KiB | 60.1 KiB |
| www.googletagmanager.com/gtm.js?id=GTM-59ZNLHC | 172.9 KiB | 59.9 KiB |
| www.googletagmanager.com/gtag/js?id=G-C7SLJ6HMJ5&cx=c>m=4e64f0&bs=ctrl2 | 179.8 KiB | 56.2 KiB |
| www.optimizely.com/assets/vidstack-BMPqs-oi-c643bb2c.js | 66.2 KiB | 55.9 KiB |
| www.optimizely.com/assets/index.es-03246ceb.js | 78.4 KiB | 45.5 KiB |
| www.optimizely.com/assets/entry-client-049d832d.js | 78.0 KiB | 38.0 KiB |
| cdn.calibermind.com/a.js | 58.7 KiB | 36.5 KiB |
| connect.facebook.net/en_US/fbevents.js | 96.3 KiB | 33.4 KiB |
| cdn.optimizely.com/public/26942930964/s/home.js | 109.6 KiB | 32.7 KiB |
| d1igp3oop3iho5.cloudfront.net/v2/8yoUTdBkNwpVOLCXeZpKdw/zaius-min.js | 37.9 KiB | 21.3 KiB |
Consider reducing the time spent parsing, compiling, and executing JS. You may find delivering smaller JS payloads helps with this. Learn how to reduce Javascript execution time.
Performance issues directly impact user engagement and conversion rates.
Consider reducing the time spent parsing, compiling and executing JS. You may find delivering smaller JS payloads helps with this. Learn how to minimize main-thread work
Performance issues directly impact user engagement and conversion rates.
| Category | Time Spent |
|---|---|
| Script Evaluation | 26.3 s |
| Style & Layout | 5.2 s |
| Other | 4.1 s |
| Rendering | 795 ms |
| Garbage Collection | 520 ms |
| Script Parsing & Compilation | 442 ms |
| Parse HTML & CSS | 172 ms |
Many navigations are performed by going back to a previous page, or forwards again. The back/forward cache (bfcache) can speed up these return navigations. Learn more about the bfcache
Performance issues directly impact user engagement and conversion rates.
| Failure reason | Failure type |
|---|---|
| The page has an unload handler in the main frame. | Actionable |
| Pages with cache-control:no-store header cannot enter back/forward cache. | Actionable |
| Pages whose main resource has cache-control:no-store cannot enter back/forward cache. | Not actionable |
| Back/forward cache is disabled because some JavaScript network request received resource with Cache-Control: no-store header. | Not actionable |
Minifying JavaScript files can reduce payload sizes and script parse time. Learn how to minify JavaScript.
Performance issues directly impact user engagement and conversion rates.
| URL | Transfer Size | Est Savings |
|---|---|---|
| www.optimizely.com/Util/EPiServer.Forms.Samples/js/EPiServerFormsSamples.js | 5.5 KiB | 3.0 KiB |
Large network payloads cost users real money and are highly correlated with long load times. Learn how to reduce payload sizes.
Performance issues directly impact user engagement and conversion rates.
Set an explicit width and height on image elements to reduce layout shifts and improve CLS. Learn how to set image dimensions
Performance issues directly impact user engagement and conversion rates.
| URL | |
|---|---|
Dolby div.mask-logo-grid > div.flex > div.flex > img.h-[3.2rem] | /contentassets/71dcdc4b907a414ba7057d2624c2883b/dolby-log... |
Shell div.mask-logo-grid > div.flex > div.flex > img.h-[3.2rem] | /contentassets/04dd25ba79f04298a76e1fb50742a117/shell-log... |
NEW ERA div.flex > div.flex > a > img.h-[3.2rem] | /contentassets/c3fc7cbd589947cbb8579ce42d6bf8ec/logo_new-... |
Salesforce div.flex > div.flex > a > img.h-[3.2rem] | /contentassets/f58ea35175bd4e25bf399e36d284d6f9/logo_sale... |
Nike div.mask-logo-grid > div.flex > div.flex > img.h-[3.2rem] | /contentassets/854ad08b9a5642f1bbda87fdfe6b81d4/nike-logo... |
Salesforce div.flex > div.flex > a > img.h-[3.2rem] | /contentassets/f58ea35175bd4e25bf399e36d284d6f9/logo_sale... |
Nike div.mask-logo-grid > div.flex > div.flex > img.h-[3.2rem] | /contentassets/854ad08b9a5642f1bbda87fdfe6b81d4/nike-logo... |
gerrie-electric-logo-light div.flex > a.group > div.mb-4 > img.h-auto | /contentassets/c40ffa9d7ca24ac68fd5e9a1fa7db2a9/gerrie-el... |
Zoom div.mask-logo-grid > div.flex > div.flex > img.h-[3.2rem] | /contentassets/638fd78be5cc45978c7d8b42bf0d31eb/zoom-logo... |
valtech-logo_light div.flex > a.group > div.mb-4 > img.h-auto | |
a black and white sign div.flex > a.group > div.mb-4 > img.h-auto |
More information about the performance of your application. These numbers don't directly affect the Performance score.
These checks highlight opportunities to improve the accessibility of your web app. Automatic detection can only detect a subset of issues and does not guarantee the accessibility of your web app, so manual testing is also encouraged.
Using ARIA attributes in roles where they are prohibited can mean that important information is not communicated to users of assistive technologies. Learn more about prohibited ARIA roles.
Performance issues directly impact user engagement and conversion rates.
| Failing Elements |
|---|
Set it. Sweat it. Send it. div > svg > g > g |
Set it. Sweat it. div > svg > g > g |
Send it. div > svg > g > g |
These are opportunities to improve the usage of ARIA in your application which may enhance the experience for users of assistive technology, like a screen reader.
Low-contrast text is difficult or impossible for many users to read. Learn how to provide sufficient color contrast.
Performance issues directly impact user engagement and conversion rates.
| Failing Elements |
|---|
One div.col-12 > div > h2.mb-2 > em |
These are opportunities to improve the legibility of your content.
Deprecated APIs will eventually be removed from the browser. Learn more about deprecated APIs.
Performance issues directly impact user engagement and conversion rates.
| Deprecation / Warning | Source |
|---|---|
| Unload event listeners are deprecated and will be removed. | js.monitor.azure.com/scripts/b/ai.2.gbl.min.js line 4, col 20343 |
| AttributionReporting |
Issues logged to the `Issues` panel in Chrome Devtools indicate unresolved problems. They can come from network request failures, insufficient security controls, and other browser concerns. Open up the Issues panel in Chrome DevTools for more details on each issue.
Performance issues directly impact user engagement and conversion rates.
| Issue type |
|---|
| Content security policy |
These checks ensure that your page is following basic search engine optimization advice. There are many additional factors Lighthouse does not score here that may affect your search ranking, including performance on Core Web Vitals. Learn more about Google Search Essentials.
Industry-standard audits powered by Google Lighthouse. — Desktop
Key metrics that affect user experience. — Desktop
First Contentful Paint First Contentful Paint — how long until the browser renders the first piece of content. Under 1.8s is good.
2.21 s
Largest Contentful Paint Largest Contentful Paint — how long until the largest visible element loads. Under 2.5s is good.
3.17 s
Total Blocking Time Total Blocking Time — total time the main thread was blocked, preventing user input. Under 200ms is good.
5.40 s
Cumulative Layout Shift Cumulative Layout Shift — measures visual stability. How much the page layout shifts during loading. Under 0.1 is good.
0.030
Speed Index Speed Index — how quickly content is visually displayed during load. Under 3.4s is good.
9.68 s
Time to Interactive Time to Interactive — how long until the page is fully interactive and responds to user input. Under 3.8s is good.
34.29 s
Audit breakdown by category with detailed findings.
Remove large, duplicate JavaScript modules from bundles to reduce unnecessary bytes consumed by network activity.
Performance issues directly impact user engagement and conversion rates.
Polyfills and transforms enable older browsers to use new JavaScript features. However, many aren't necessary for modern browsers. Consider modifying your JavaScript build process to not transpile Baseline features, unless you know you must support older browsers. Learn why most sites can deploy ES6+ code without transpiling
Shipping ES5 transpiled code to modern browsers wastes bytes — every user with an evergreen browser pays for compatibility you don't need.
Most users today run browsers that natively support ES6+, async/await, optional chaining, and the rest of modern JavaScript. Transpiling to ES5 'just in case' adds 20-40% to your bundle for no benefit. Configure your build to target a modern browserslist, or ship a differential bundle pair (modern + legacy) with the module/nomodule pattern.
Source: Google web.dev / Lighthouse
3rd party code can significantly impact load performance. Reduce and defer loading of 3rd party code to prioritize your page's content.
Performance issues directly impact user engagement and conversion rates.
A long cache lifetime can speed up repeat visits to your page. Learn more about caching.
Performance issues directly impact user engagement and conversion rates.
Your first network request is the most important. Reduce its latency by avoiding redirects, ensuring a fast server response, and enabling text compression.
Performance issues directly impact user engagement and conversion rates.
A forced reflow occurs when JavaScript queries geometric properties (such as offsetWidth) after styles have been invalidated by a change to the DOM state. This can result in poor performance. Learn more about forced reflows and possible mitigations.
Performance issues directly impact user engagement and conversion rates.
Optimize LCP by making the LCP image discoverable from the HTML immediately, and avoiding lazy-loading
Performance issues directly impact user engagement and conversion rates.
Avoid chaining critical requests by reducing the length of chains, reducing the download size of resources, or deferring the download of unnecessary resources to improve page load.
Performance issues directly impact user engagement and conversion rates.
Requests are blocking the page's initial render, which may delay LCP. Deferring or inlining can move these network requests out of the critical path.
Performance issues directly impact user engagement and conversion rates.
| URL | Transfer Size | Duration |
|---|---|---|
| cdn.optimizely.com/public/26942930964/s/home.js | 109.9 KiB | 175 ms |
| www.optimizely.com/assets/opti-grid.component-65b7434a.css | 9.3 KiB | 280 ms |
| www.optimizely.com/Util/EPiServer.Forms/EPiServerForms.css | 1.4 KiB | 88 ms |
| www.optimizely.com/assets/custom-radio-737ddd70.css | 867 B | 216 ms |
| www.optimizely.com/assets/custom-checkbox-dc96214f.css | 935 B | 216 ms |
| www.optimizely.com/assets/custom-form-0a4bb47a.css | 13.3 KiB | 280 ms |
| www.optimizely.com/assets/media.component-3b52cfc2.css | 2.8 KiB | 216 ms |
| www.optimizely.com/assets/container-f8669ecc.css | 1.8 KiB | 216 ms |
| www.optimizely.com/assets/entry-client-1dd1561b.css | 39.9 KiB | 535 ms |
| www.optimizely.com/assets/text.component-af81af83.css | 593 B | 216 ms |
Reducing the download time of images can improve the perceived load time of the page and LCP. Learn more about optimizing image size
Performance issues directly impact user engagement and conversion rates.
| URL | Resource Size | Est Savings | |
|---|---|---|---|
div.row > div.col-12 > div.absolute > img.opal-shape div.row > div.col-12 > div.absolute > img.opal-shape | www.optimizely.com/assets/opal-bg-16807e11.png | 245.7 KiB | 92.2 KiB |
div#skipNav > main.react-module > div.home-hero > ::after div#skipNav > main.react-module > div.home-hero > ::after | www.optimizely.com/assets/noise-7867172c.png | 22.1 KiB | 11.4 KiB |
These insights are also available in the Chrome DevTools Performance Panel - record a trace to view more detailed information.
Time to Interactive is the amount of time it takes for the page to become fully interactive. Learn more about the Time to Interactive metric.
Performance issues directly impact user engagement and conversion rates.
Redirects introduce additional delays before the page can be loaded. Learn how to avoid page redirects.
Performance issues directly impact user engagement and conversion rates.
| URL | Time Spent |
|---|---|
| optimizely.com/ | 232 ms |
| www.optimizely.com/ | 0.0 ms |
The maximum potential First Input Delay that your users could experience is the duration of the longest task. Learn more about the Maximum Potential First Input Delay metric.
Performance issues directly impact user engagement and conversion rates.
Reduce unused rules from stylesheets and defer CSS not used for above-the-fold content to decrease bytes consumed by network activity. Learn how to reduce unused CSS.
Performance issues directly impact user engagement and conversion rates.
| URL | Transfer Size | Est Savings |
|---|---|---|
| www.optimizely.com/assets/entry-client-1dd1561b.css | 39.7 KiB | 36.0 KiB |
| www.optimizely.com/assets/custom-form-0a4bb47a.css | 13.0 KiB | 11.7 KiB |
Reduce unused JavaScript and defer loading scripts until they are required to decrease bytes consumed by network activity. Learn how to reduce unused JavaScript.
Multi-megabyte JavaScript bundles delay every interactive feature on the page.
This is the Lighthouse audit fired when too much JS is shipped relative to what executes. The fix isn't a config flag — it requires bundle analysis (webpack-bundle-analyzer, rollup-plugin-visualizer), splitting routes into chunks, lazy-loading off-screen components, and removing unused dependencies. Fundamentally different from minification: minifying reduces byte count, this reduces what's downloaded at all.
Source: Google web.dev / Lighthouse
| URL | Transfer Size | Est Savings |
|---|---|---|
| www.gstatic.com/recaptcha/releases/gTpTIWhbKpxADzTzkcabhXN4/recaptcha__en.js | 361.8 KiB | 155.1 KiB |
| www.optimizely.com/Util/EPiServer.Forms.Samples/jquery-ui/jquery-ui.min.js | 67.5 KiB | 60.1 KiB |
| www.googletagmanager.com/gtm.js?id=GTM-59ZNLHC | 172.9 KiB | 59.9 KiB |
| js.qualified.com/qualified.js?token=y5gZpv1sRkv2ZBXW | 115.9 KiB | 57.0 KiB |
| www.optimizely.com/assets/vidstack-BMPqs-oi-c643bb2c.js | 66.1 KiB | 55.8 KiB |
| www.googletagmanager.com/gtag/js?id=G-C7SLJ6HMJ5&cx=c>m=4e64f0 | 179.8 KiB | 55.7 KiB |
| js.qualified.com/packs/js/multimodal_v2-f8a905b1.js | 93.6 KiB | 47.9 KiB |
| www.optimizely.com/assets/index.es-03246ceb.js | 78.4 KiB | 45.5 KiB |
| cdn.calibermind.com/a.js | 58.5 KiB | 36.4 KiB |
| www.optimizely.com/assets/entry-client-049d832d.js | 77.7 KiB | 36.2 KiB |
| connect.facebook.net/en_US/fbevents.js | 96.3 KiB | 33.3 KiB |
| cdn.optimizely.com/public/26942930964/s/home.js | 109.6 KiB | 31.9 KiB |
| d1igp3oop3iho5.cloudfront.net/v2/8yoUTdBkNwpVOLCXeZpKdw/zaius-min.js | 37.9 KiB | 21.3 KiB |
Consider reducing the time spent parsing, compiling, and executing JS. You may find delivering smaller JS payloads helps with this. Learn how to reduce Javascript execution time.
Performance issues directly impact user engagement and conversion rates.
Consider reducing the time spent parsing, compiling and executing JS. You may find delivering smaller JS payloads helps with this. Learn how to minimize main-thread work
Performance issues directly impact user engagement and conversion rates.
| Category | Time Spent |
|---|---|
| Style & Layout | 34.5 s |
| Script Evaluation | 6.7 s |
| Other | 1.7 s |
| Rendering | 568 ms |
| Garbage Collection | 175 ms |
| Script Parsing & Compilation | 154 ms |
| Parse HTML & CSS | 49 ms |
Many navigations are performed by going back to a previous page, or forwards again. The back/forward cache (bfcache) can speed up these return navigations. Learn more about the bfcache
Performance issues directly impact user engagement and conversion rates.
| Failure reason | Failure type |
|---|---|
| The page has an unload handler in the main frame. | Actionable |
| Pages with cache-control:no-store header cannot enter back/forward cache. | Actionable |
| Pages with WebSocket cannot enter back/forward cache. | Pending browser support |
| Pages whose main resource has cache-control:no-store cannot enter back/forward cache. | Not actionable |
| Back/forward cache is disabled because some JavaScript network request received resource with Cache-Control: no-store header. | Not actionable |
| Back/forward cache is disabled because WebSocket has been used. | Not actionable |
Minifying JavaScript files can reduce payload sizes and script parse time. Learn how to minify JavaScript.
Performance issues directly impact user engagement and conversion rates.
| URL | Transfer Size | Est Savings |
|---|---|---|
| www.optimizely.com/Util/EPiServer.Forms.Samples/js/EPiServerFormsSamples.js | 5.5 KiB | 3.0 KiB |
Large network payloads cost users real money and are highly correlated with long load times. Learn how to reduce payload sizes.
Performance issues directly impact user engagement and conversion rates.
Set an explicit width and height on image elements to reduce layout shifts and improve CLS. Learn how to set image dimensions
Performance issues directly impact user engagement and conversion rates.
| URL | |
|---|---|
div.row > div.col-12 > div.absolute > img.opal-shape div.row > div.col-12 > div.absolute > img.opal-shape | www.optimizely.com/assets/opal-bg-16807e11.png |
Dolby div.mask-logo-grid > div.flex > div.flex > img.h-[3.2rem] | /contentassets/71dcdc4b907a414ba7057d2624c2883b/dolby-log... |
Shell div.mask-logo-grid > div.flex > div.flex > img.h-[3.2rem] | /contentassets/04dd25ba79f04298a76e1fb50742a117/shell-log... |
NEW ERA div.flex > div.flex > a > img.h-[3.2rem] | /contentassets/c3fc7cbd589947cbb8579ce42d6bf8ec/logo_new-... |
Salesforce div.flex > div.flex > a > img.h-[3.2rem] | /contentassets/f58ea35175bd4e25bf399e36d284d6f9/logo_sale... |
Nike div.mask-logo-grid > div.flex > div.flex > img.h-[3.2rem] | /contentassets/854ad08b9a5642f1bbda87fdfe6b81d4/nike-logo... |
Salesforce div.flex > div.flex > a > img.h-[3.2rem] | /contentassets/f58ea35175bd4e25bf399e36d284d6f9/logo_sale... |
Nike div.mask-logo-grid > div.flex > div.flex > img.h-[3.2rem] | /contentassets/854ad08b9a5642f1bbda87fdfe6b81d4/nike-logo... |
Zoom div.mask-logo-grid > div.flex > div.flex > img.h-[3.2rem] | /contentassets/638fd78be5cc45978c7d8b42bf0d31eb/zoom-logo... |
More information about the performance of your application. These numbers don't directly affect the Performance score.
These checks highlight opportunities to improve the accessibility of your web app. Automatic detection can only detect a subset of issues and does not guarantee the accessibility of your web app, so manual testing is also encouraged.
Using ARIA attributes in roles where they are prohibited can mean that important information is not communicated to users of assistive technologies. Learn more about prohibited ARIA roles.
Performance issues directly impact user engagement and conversion rates.
| Failing Elements |
|---|
AI assistant body.theme--dark > q-focus-sentinel > div |
After AI assistant body.theme--dark > q-focus-sentinel > div |
AI assistant, start div#qualified-multimodal-host > div |
AI assistant, end div#qualified-multimodal-host > div |
These are opportunities to improve the usage of ARIA in your application which may enhance the experience for users of assistive technology, like a screen reader.
Properly ordered headings that do not skip levels convey the semantic structure of the page, making it easier to navigate and understand when using assistive technologies. Learn more about heading order.
Performance issues directly impact user engagement and conversion rates.
| Failing Elements |
|---|
Optimizely Opal (AI) div.text-block-component > div.text-block > div.rte > h3 |
These are opportunities to improve keyboard navigation in your application.
Visible text labels that do not match the accessible name can result in a confusing experience for screen reader users. Learn more about accessible names.
Performance issues directly impact user engagement and conversion rates.
| Failing Elements |
|---|
Partners section.primary-footer__section > ul.primary-footer__section-links > li > a.primary-footer__section-link |
Deprecated APIs will eventually be removed from the browser. Learn more about deprecated APIs.
Performance issues directly impact user engagement and conversion rates.
| Deprecation / Warning | Source |
|---|---|
| Unload event listeners are deprecated and will be removed. | js.monitor.azure.com/scripts/b/ai.2.gbl.min.js line 4, col 20343 |
| AttributionReporting |
Errors logged to the console indicate unresolved problems. They can come from network request failures and other browser concerns. Learn more about this errors in console diagnostic audit
Performance issues directly impact user engagement and conversion rates.
| Source | Description |
|---|---|
www.optimizely.com/assets/entry-client-049d832d.js line 60, col 5568 | Error: componentName is empty
at https://www.optimizely.com/assets/entry-client-049d832d.js:61:5569
at Array.forEach (<anonymous>)
at Gy (https://www.optimizely.com/assets/entry-client-049d832d.js:61:5482)
at https://www.optimizely.com/assets/entry-client-049d832d.js:70:6645 |
www.optimizely.com/assets/entry-client-049d832d.js line 56, col 4788 | Error: Minified React error #418; visit https://reactjs.org/docs/error-decoder.html?invariant=418 for the full message or use the non-minified dev environment for full errors and additional helpful warnings.
at Ea (https://www.optimizely.com/assets/entry-client-049d832d.js:57:4789)
at ip (https://www.optimizely.com/assets/entry-client-049d832d.js:59:45388)
at np (https://www.optimizely.com/assets/entry-client-049d832d.js:59:39600)
at sg (https://www.optimizely.com/assets/entry-client-049d832d.js:59:39528)
at _i (https://www.optimizely.com/assets/entry-client-049d832d.js:59:39383)
at bd (https://www.optimizely.com/assets/entry-client-049d832d.js:59:34493)
at T (https://www.optimizely.com/assets/entry-client-049d832d.js:44:1570)
at MessagePort.un (https://www.optimizely.com/assets/entry-client-049d832d.js:44:1940) |
www.optimizely.com/assets/entry-client-049d832d.js line 56, col 4907 | Error: Minified React error #418; visit https://reactjs.org/docs/error-decoder.html?invariant=418 for the full message or use the non-minified dev environment for full errors and additional helpful warnings.
at Ea (https://www.optimizely.com/assets/entry-client-049d832d.js:57:4908)
at ip (https://www.optimizely.com/assets/entry-client-049d832d.js:59:45388)
at np (https://www.optimizely.com/assets/entry-client-049d832d.js:59:39600)
at sg (https://www.optimizely.com/assets/entry-client-049d832d.js:59:39528)
at _i (https://www.optimizely.com/assets/entry-client-049d832d.js:59:39383)
at bd (https://www.optimizely.com/assets/entry-client-049d832d.js:59:34493)
at T (https://www.optimizely.com/assets/entry-client-049d832d.js:44:1570)
at MessagePort.un (https://www.optimizely.com/assets/entry-client-049d832d.js:44:1940) |
www.optimizely.com/assets/entry-client-049d832d.js line 58, col 45047 | Error: Minified React error #423; visit https://reactjs.org/docs/error-decoder.html?invariant=423 for the full message or use the non-minified dev environment for full errors and additional helpful warnings.
at ip (https://www.optimizely.com/assets/entry-client-049d832d.js:59:45048)
at np (https://www.optimizely.com/assets/entry-client-049d832d.js:59:39600)
at sg (https://www.optimizely.com/assets/entry-client-049d832d.js:59:39528)
at _i (https://www.optimizely.com/assets/entry-client-049d832d.js:59:39383)
at Ma (https://www.optimizely.com/assets/entry-client-049d832d.js:59:35774)
at bd (https://www.optimizely.com/assets/entry-client-049d832d.js:59:34725)
at T (https://www.optimizely.com/assets/entry-client-049d832d.js:44:1570)
at MessagePort.un (https://www.optimizely.com/assets/entry-client-049d832d.js:44:1940) |
www.optimizely.com/assets/entry-client-049d832d.js line 56, col 67 | Error: Minified React error #425; visit https://reactjs.org/docs/error-decoder.html?invariant=425 for the full message or use the non-minified dev environment for full errors and additional helpful warnings.
at To (https://www.optimizely.com/assets/entry-client-049d832d.js:57:68)
at tg (https://www.optimizely.com/assets/entry-client-049d832d.js:59:16018)
at rp (https://www.optimizely.com/assets/entry-client-049d832d.js:59:39908)
at np (https://www.optimizely.com/assets/entry-client-049d832d.js:59:39661)
at sg (https://www.optimizely.com/assets/entry-client-049d832d.js:59:39528)
at _i (https://www.optimizely.com/assets/entry-client-049d832d.js:59:39383)
at bd (https://www.optimizely.com/assets/entry-client-049d832d.js:59:34493)
at T (https://www.optimizely.com/assets/entry-client-049d832d.js:44:1570)
at MessagePort.un (https://www.optimizely.com/assets/entry-client-049d832d.js:44:1940) |
www.optimizely.com/assets/entry-client-049d832d.js line 56, col 67 | Error: Minified React error #425; visit https://reactjs.org/docs/error-decoder.html?invariant=425 for the full message or use the non-minified dev environment for full errors and additional helpful warnings.
at To (https://www.optimizely.com/assets/entry-client-049d832d.js:57:68)
at tg (https://www.optimizely.com/assets/entry-client-049d832d.js:59:18797)
at rp (https://www.optimizely.com/assets/entry-client-049d832d.js:59:39908)
at np (https://www.optimizely.com/assets/entry-client-049d832d.js:59:39661)
at sg (https://www.optimizely.com/assets/entry-client-049d832d.js:59:39528)
at _i (https://www.optimizely.com/assets/entry-client-049d832d.js:59:39383)
at bd (https://www.optimizely.com/assets/entry-client-049d832d.js:59:34493)
at T (https://www.optimizely.com/assets/entry-client-049d832d.js:44:1570)
at MessagePort.un (https://www.optimizely.com/assets/entry-client-049d832d.js:44:1940) |
Issues logged to the `Issues` panel in Chrome Devtools indicate unresolved problems. They can come from network request failures, insufficient security controls, and other browser concerns. Open up the Issues panel in Chrome DevTools for more details on each issue.
Performance issues directly impact user engagement and conversion rates.
| Issue type |
|---|
| Content security policy |
These checks ensure that your page is following basic search engine optimization advice. There are many additional factors Lighthouse does not score here that may affect your search ranking, including performance on Core Web Vitals. Learn more about Google Search Essentials.
Send Feedback