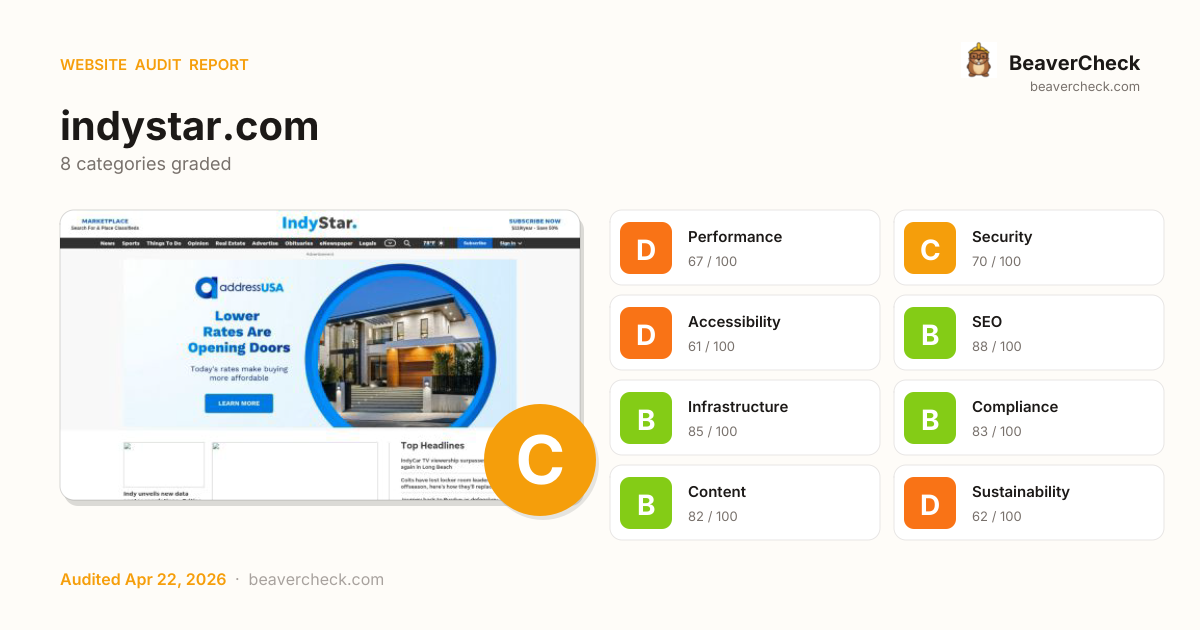
Mobile 375 × 812

Desktop 1440 × 900

Score: 73 / 100
Based on 8 categories, 0 sections
Room to improve — your 3.5s load time is above Google's 2.5s 'Good' threshold.
Good foundation, but a few gaps could be exploited.
Several issues make your site difficult for assistive technology users.
Well-optimized for search — your content is discoverable.
Solid infrastructure — fast server responses across the board.
Mostly compliant — a few items need attention.
Good content signals with minor gaps.
Heavier than average — reducing page weight saves energy and bandwidth.
The overall score is a weighted average of individual category scores. Categories with more impact on user experience and security carry more weight.
Weights reflect general web best practices. Individual needs may differ.
HSTS header is missing
Security gaps expose your site and users to attacks, eroding trust.
Page weighs 16.0 MB (5.2 MB transferred)
Performance issues directly impact user engagement and conversion rates.
22 link(s) with no accessible text
Accessibility issues exclude users with disabilities — up to 15% of your potential audience.
558 third-party resources (100% of weight)
Performance issues directly impact user engagement and conversion rates.
559 HTTP requests — consider bundling or reducing
Performance issues directly impact user engagement and conversion rates.
High impact, low effort — start here.
High impact, requires investment.
Small gains, minimal effort.
Nothing in this quadrant — good news.
Low impact, high effort — do last.
Nothing in this quadrant — good news.
[](https://beavercheck.com/results/edc01e16-8a08-471f-8ea5-9a82d2fc8916)<a href="https://beavercheck.com/results/edc01e16-8a08-471f-8ea5-9a82d2fc8916"><img src="https://beavercheck.com/badge?url=https%3A%2F%2Findystar.com" alt="BeaverCheck Score"></a>https://beavercheck.com/badge?url=https%3A%2F%2Findystar.comThis badge auto-updates with your latest scan result.
Your site performs reasonably well, but a few targeted fixes could meaningfully improve results. Your LCP of 3.5s exceeds Google's 2.5s 'Good' threshold and the 3 performance issues below directly contribute to it. Addressing the critical issues below would have the most immediate impact on your user trust.
7 barrier(s) likely increasing bounce by ~23%.
Page loads in 3.5s
+5% bounceEvery additional 100ms above 2.5s costs conversions — you're 985ms over
Fix: Target <2.5s LCP: defer non-critical scripts and optimize the hero image
Page feels frozen for 8.0s
+5% bounceClicks on the primary CTA are ignored while JavaScript runs
Fix: Break up long tasks; defer non-critical JavaScript to post-hydration
No HSTS header
+1% bounceReturning visitors are briefly exposed to downgrade attacks on first request
Fix: Set Strict-Transport-Security: max-age=31536000; includeSubDomains
No Content-Security-Policy header
+1% bounceHigher XSS blast radius — one compromised script can exfiltrate the checkout form
Fix: Ship a reporting-only CSP first, then enforce once violations are clean
22 link(s) with generic text ("click here", "read more")
+1% bounceScreen-reader users navigating by link list see no context — and search engines can't infer relevance
Fix: Rewrite with descriptive phrases that identify the destination
No skip-to-content link
+1% bounceKeyboard and screen-reader users must tab through the entire header on every page
Fix: Add a visible-on-focus <a href="#main">Skip to content</a> as the first focusable element
29 broken link(s) on the page
+5% bounceClicks land on 404s — trust drops and the session often ends
Fix: Fix or remove the broken destinations surfaced on the Content tab
Preliminary CRO audit — each barrier links to the tab with detailed analysis.
$800 investment → $1,855/month returns + USD 157,500 risk avoided
$800
8h · 5 findings
$1,855 /mo
~$22,264 / year
USD 157,500
if kept compliant
$50 — in quick wins — start here for the fastest payback
Figures combine localized regulatory fine ceilings, search/conversion value priced against local CPC, and bandwidth waste estimates. Results depend on implementation quality and audience composition. Not legal or financial advice.
8.0 developer hours at $100/hr
Based on United States rates ($100/hr)
Start here for the best return on investment
$13,126 / month at risk
~$157,516 / year if left unfixed
$157,500
+3 more
$1.32 /mo
16508.0 MB/mo × 0.080 USD/GB
Compliance figures represent the statutory maximum fine for the most severe triggered category, capped per regulation — not the sum of per-finding penalties. Based on published regulatory fine ranges. This is not legal advice.
Unique monthly visitors from your analytics
Purchases, signups, or key actions
Optional — for revenue estimation
more engaged visitors from reduced bounce
Fix 3 critical issues to capture this value
Based on Google/Deloitte research ("Milliseconds Make Millions") showing a ~7% bounce rate increase per additional second of LCP above the 2.5s "Good" threshold.
Your site's LCP: → estimated after fixes.
These are estimates based on industry research — actual results vary
Your data stays in your browser — nothing is sent to our servers
Thanks for your feedback!
We'll use a cached audit if available, or offer to scan.
Industry-standard audits powered by Google Lighthouse.
Key metrics that affect user experience.
First Contentful Paint First Contentful Paint — how long until the browser renders the first piece of content. Under 1.8s is good.
3.28 s
Largest Contentful Paint Largest Contentful Paint — how long until the largest visible element loads. Under 2.5s is good.
3.48 s
Total Blocking Time Total Blocking Time — total time the main thread was blocked, preventing user input. Under 200ms is good.
8.02 s
Cumulative Layout Shift Cumulative Layout Shift — measures visual stability. How much the page layout shifts during loading. Under 0.1 is good.
0.000
Speed Index Speed Index — how quickly content is visually displayed during load. Under 3.4s is good.
23.26 s
Time to Interactive Time to Interactive — how long until the page is fully interactive and responds to user input. Under 3.8s is good.
42.67 s
Audit breakdown by category with detailed findings.
Remove large, duplicate JavaScript modules from bundles to reduce unnecessary bytes consumed by network activity.
Performance issues directly impact user engagement and conversion rates.
Polyfills and transforms enable older browsers to use new JavaScript features. However, many aren't necessary for modern browsers. Consider modifying your JavaScript build process to not transpile Baseline features, unless you know you must support older browsers. Learn why most sites can deploy ES6+ code without transpiling
Shipping ES5 transpiled code to modern browsers wastes bytes — every user with an evergreen browser pays for compatibility you don't need.
Most users today run browsers that natively support ES6+, async/await, optional chaining, and the rest of modern JavaScript. Transpiling to ES5 'just in case' adds 20-40% to your bundle for no benefit. Configure your build to target a modern browserslist, or ship a differential bundle pair (modern + legacy) with the module/nomodule pattern.
Source: Google web.dev / Lighthouse
3rd party code can significantly impact load performance. Reduce and defer loading of 3rd party code to prioritize your page's content.
Performance issues directly impact user engagement and conversion rates.
Your first network request is the most important. Reduce its latency by avoiding redirects, ensuring a fast server response, and enabling text compression.
Performance issues directly impact user engagement and conversion rates.
A forced reflow occurs when JavaScript queries geometric properties (such as offsetWidth) after styles have been invalidated by a change to the DOM state. This can result in poor performance. Learn more about forced reflows and possible mitigations.
Performance issues directly impact user engagement and conversion rates.
Avoid chaining critical requests by reducing the length of chains, reducing the download size of resources, or deferring the download of unnecessary resources to improve page load.
Performance issues directly impact user engagement and conversion rates.
A long cache lifetime can speed up repeat visits to your page. Learn more about caching.
Performance issues directly impact user engagement and conversion rates.
Reducing the download time of images can improve the perceived load time of the page and LCP. Learn more about optimizing image size
Performance issues directly impact user engagement and conversion rates.
| URL | Resource Size | Est Savings | |
|---|---|---|---|
head > link head > link | tpc.googlesyndication.com/simgad/16170270305708396939? | 383.7 KiB | 303.0 KiB |
head > link head > link | s0.2mdn.net/sadbundle/6424884103987137592/dream32050/dream32050.jpeg | 64.7 KiB | 56.7 KiB |
These insights are also available in the Chrome DevTools Performance Panel - record a trace to view more detailed information.
Time to Interactive is the amount of time it takes for the page to become fully interactive. Learn more about the Time to Interactive metric.
Performance issues directly impact user engagement and conversion rates.
The maximum potential First Input Delay that your users could experience is the duration of the longest task. Learn more about the Maximum Potential First Input Delay metric.
Performance issues directly impact user engagement and conversion rates.
Redirects introduce additional delays before the page can be loaded. Learn how to avoid page redirects.
Performance issues directly impact user engagement and conversion rates.
| URL | Time Spent |
|---|---|
| indystar.com/ | 1.3 s |
| www.indystar.com/ | 0.0 ms |
Consider reducing the time spent parsing, compiling, and executing JS. You may find delivering smaller JS payloads helps with this. Learn how to reduce Javascript execution time.
Performance issues directly impact user engagement and conversion rates.
Consider reducing the time spent parsing, compiling and executing JS. You may find delivering smaller JS payloads helps with this. Learn how to minimize main-thread work
Performance issues directly impact user engagement and conversion rates.
| Category | Time Spent |
|---|---|
| Script Evaluation | 19.7 s |
| Other | 4.6 s |
| Script Parsing & Compilation | 2.0 s |
| Style & Layout | 1.2 s |
| Garbage Collection | 973 ms |
| Parse HTML & CSS | 308 ms |
| Rendering | 190 ms |
Many navigations are performed by going back to a previous page, or forwards again. The back/forward cache (bfcache) can speed up these return navigations. Learn more about the bfcache
Performance issues directly impact user engagement and conversion rates.
| Failure reason | Failure type |
|---|---|
| Pages with cache-control:no-store header cannot enter back/forward cache. | Actionable |
| The page has an unload handler in a sub frame. | Actionable |
| Pages whose main resource has cache-control:no-store cannot enter back/forward cache. | Not actionable |
| Back/forward cache is disabled because some JavaScript network request received resource with Cache-Control: no-store header. | Not actionable |
Minifying JavaScript files can reduce payload sizes and script parse time. Learn how to minify JavaScript.
Performance issues directly impact user engagement and conversion rates.
| URL | Transfer Size | Est Savings |
|---|---|---|
| cdn.taboola.com/libtrc/gannett-network/loader.js | 454.0 KiB | 89.8 KiB |
Reduce unused rules from stylesheets and defer CSS not used for above-the-fold content to decrease bytes consumed by network activity. Learn how to reduce unused CSS.
Performance issues directly impact user engagement and conversion rates.
| URL | Transfer Size | Est Savings |
|---|---|---|
| .trc_rbox_container { direction: ltr; text-align: left; } … | 22.2 KiB | 17.2 KiB |
| :root { --cm-video-brand-primary: var(--yb-grape-jelly, #7e1fff); --cm-video-brand-secondary: v… | 16.0 KiB | 15.5 KiB |
Reduce unused JavaScript and defer loading scripts until they are required to decrease bytes consumed by network activity. Learn how to reduce unused JavaScript.
Multi-megabyte JavaScript bundles delay every interactive feature on the page.
This is the Lighthouse audit fired when too much JS is shipped relative to what executes. The fix isn't a config flag — it requires bundle analysis (webpack-bundle-analyzer, rollup-plugin-visualizer), splitting routes into chunks, lazy-loading off-screen components, and removing unused dependencies. Fundamentally different from minification: minifying reduces byte count, this reduces what's downloaded at all.
Source: Google web.dev / Lighthouse
Large network payloads cost users real money and are highly correlated with long load times. Learn how to reduce payload sizes.
Performance issues directly impact user engagement and conversion rates.
More information about the performance of your application. These numbers don't directly affect the Performance score.
These checks highlight opportunities to improve the accessibility of your web app. Automatic detection can only detect a subset of issues and does not guarantee the accessibility of your web app, so manual testing is also encouraged.
Using ARIA attributes in roles where they are prohibited can mean that important information is not communicated to users of assistive technologies. Learn more about prohibited ARIA roles.
Performance issues directly impact user engagement and conversion rates.
| Failing Elements |
|---|
content body > main.gnt_cw > gnt-lm |
News content body > main.gnt_cw > gnt-lm |
Sports content body > main.gnt_cw > gnt-lm |
Things To Do content body > main.gnt_cw > gnt-lm |
Opinion content body > main.gnt_cw > gnt-lm |
These are opportunities to improve the usage of ARIA in your application which may enhance the experience for users of assistive technology, like a screen reader.
Touch targets with sufficient size and spacing help users who may have difficulty targeting small controls to activate the targets. Learn more about touch targets.
Performance issues directly impact user engagement and conversion rates.
| Failing Elements |
|---|
Ad span.video-label-box > span.branding > div.logoDiv > a.trc_mobile_disclosure_link |
These items highlight common accessibility best practices.
Visible text labels that do not match the accessible name can result in a confusing experience for screen reader users. Learn more about accessible names.
Performance issues directly impact user engagement and conversion rates.
| Failing Elements |
|---|
Ad span.video-label-box > span.branding > div.logoDiv > a.trc_mobile_disclosure_link |
Deprecated APIs will eventually be removed from the browser. Learn more about deprecated APIs.
Performance issues directly impact user engagement and conversion rates.
| Deprecation / Warning | Source |
|---|---|
| Topics | |
| SharedStorage | /pagead/managed/js/activeview/current/ufs_web_display.js line 252, col 234 |
| Unload event listeners are deprecated and will be removed. | cdn.adnxs.com/v/s/252/trk.js line 559, col 5595 |
Errors logged to the console indicate unresolved problems. They can come from network request failures and other browser concerns. Learn more about this errors in console diagnostic audit
Performance issues directly impact user engagement and conversion rates.
| Source | Description |
|---|---|
Access to fetch at 'https://rp.liadm.com/p?aid=a-047k&pu=https%3A%2F%2Fwww.indystar.com%2F&ext_gannett=cfb31c78-1075-4ca4-969a-22bf71d376a1&n3pc=true' from origin 'https://www.indystar.com' has been blocked by CORS policy: No 'Access-Control-Allow-Origin' header is present on the requested resource. | |
Failed to load resource: net::ERR_FAILED | |
Failed to load resource: net::ERR_NAME_NOT_RESOLVED | |
Failed to load resource: the server responded with a status of 400 () | |
Failed to load resource: the server responded with a status of 406 () | |
Failed to load resource: the server responded with a status of 503 () | |
Object | |
Refused to execute script from 'https://cm.g.doubleclick.net/pixel?google_nid=contextweb&google_cm=&google_sc=&google_hm=WDJvdGtCVVlzT2c4OXZ1RGQ4UWRsZw&gdpr=&gdpr_consent=&google_tc=' because its MIME type ('image/png') is not executable. |
These checks ensure that your page is following basic search engine optimization advice. There are many additional factors Lighthouse does not score here that may affect your search ranking, including performance on Core Web Vitals. Learn more about Google Search Essentials.
Search engines may use `href` attributes on links to crawl websites. Ensure that the `href` attribute of anchor elements links to an appropriate destination, so more pages of the site can be discovered. Learn how to make links crawlable
Performance issues directly impact user engagement and conversion rates.
| Uncrawlable Link |
|---|
Image for Taboola Advertising Unit div#rbox-h2v > div#internal_trc_6507949321 > div.videoCube > a.item-thumbnail-href |
This might be relevant for you
Ad div#rbox-h2v > div#internal_trc_6507949321 > div.videoCube > a.item-label-href |
To appear in search results, crawlers need access to your app.
Industry-standard audits powered by Google Lighthouse. — Desktop
Key metrics that affect user experience. — Desktop
First Contentful Paint First Contentful Paint — how long until the browser renders the first piece of content. Under 1.8s is good.
1.38 s
Largest Contentful Paint Largest Contentful Paint — how long until the largest visible element loads. Under 2.5s is good.
1.72 s
Total Blocking Time Total Blocking Time — total time the main thread was blocked, preventing user input. Under 200ms is good.
538 ms
Cumulative Layout Shift Cumulative Layout Shift — measures visual stability. How much the page layout shifts during loading. Under 0.1 is good.
0.069
Speed Index Speed Index — how quickly content is visually displayed during load. Under 3.4s is good.
6.27 s
Time to Interactive Time to Interactive — how long until the page is fully interactive and responds to user input. Under 3.8s is good.
9.68 s
Audit breakdown by category with detailed findings.
Remove large, duplicate JavaScript modules from bundles to reduce unnecessary bytes consumed by network activity.
Performance issues directly impact user engagement and conversion rates.
Polyfills and transforms enable older browsers to use new JavaScript features. However, many aren't necessary for modern browsers. Consider modifying your JavaScript build process to not transpile Baseline features, unless you know you must support older browsers. Learn why most sites can deploy ES6+ code without transpiling
Shipping ES5 transpiled code to modern browsers wastes bytes — every user with an evergreen browser pays for compatibility you don't need.
Most users today run browsers that natively support ES6+, async/await, optional chaining, and the rest of modern JavaScript. Transpiling to ES5 'just in case' adds 20-40% to your bundle for no benefit. Configure your build to target a modern browserslist, or ship a differential bundle pair (modern + legacy) with the module/nomodule pattern.
Source: Google web.dev / Lighthouse
3rd party code can significantly impact load performance. Reduce and defer loading of 3rd party code to prioritize your page's content.
Performance issues directly impact user engagement and conversion rates.
Your first network request is the most important. Reduce its latency by avoiding redirects, ensuring a fast server response, and enabling text compression.
Performance issues directly impact user engagement and conversion rates.
A forced reflow occurs when JavaScript queries geometric properties (such as offsetWidth) after styles have been invalidated by a change to the DOM state. This can result in poor performance. Learn more about forced reflows and possible mitigations.
Performance issues directly impact user engagement and conversion rates.
Avoid chaining critical requests by reducing the length of chains, reducing the download size of resources, or deferring the download of unnecessary resources to improve page load.
Performance issues directly impact user engagement and conversion rates.
A long cache lifetime can speed up repeat visits to your page. Learn more about caching.
Performance issues directly impact user engagement and conversion rates.
Reducing the download time of images can improve the perceived load time of the page and LCP. Learn more about optimizing image size
Performance issues directly impact user engagement and conversion rates.
| URL | Resource Size | Est Savings | |
|---|---|---|---|
head > link head > link | tpc.googlesyndication.com/simgad/12886114848328020562? | 580.9 KiB | 450.9 KiB |
head > link head > link | /simgad/1718768457543532452?sqp=uqWu0g0HCFoQ2AVAZA&rs=AOg... | 49.4 KiB | 38.7 KiB |
These insights are also available in the Chrome DevTools Performance Panel - record a trace to view more detailed information.
Redirects introduce additional delays before the page can be loaded. Learn how to avoid page redirects.
Performance issues directly impact user engagement and conversion rates.
| URL | Time Spent |
|---|---|
| indystar.com/ | 768 ms |
| www.indystar.com/ | 0.0 ms |
Time to Interactive is the amount of time it takes for the page to become fully interactive. Learn more about the Time to Interactive metric.
Performance issues directly impact user engagement and conversion rates.
The maximum potential First Input Delay that your users could experience is the duration of the longest task. Learn more about the Maximum Potential First Input Delay metric.
Performance issues directly impact user engagement and conversion rates.
Consider reducing the time spent parsing, compiling, and executing JS. You may find delivering smaller JS payloads helps with this. Learn how to reduce Javascript execution time.
Performance issues directly impact user engagement and conversion rates.
Consider reducing the time spent parsing, compiling and executing JS. You may find delivering smaller JS payloads helps with this. Learn how to minimize main-thread work
Performance issues directly impact user engagement and conversion rates.
| Category | Time Spent |
|---|---|
| Script Evaluation | 3.7 s |
| Other | 867 ms |
| Script Parsing & Compilation | 433 ms |
| Style & Layout | 302 ms |
| Garbage Collection | 190 ms |
| Parse HTML & CSS | 69 ms |
| Rendering | 45 ms |
Many navigations are performed by going back to a previous page, or forwards again. The back/forward cache (bfcache) can speed up these return navigations. Learn more about the bfcache
Performance issues directly impact user engagement and conversion rates.
| Failure reason | Failure type |
|---|---|
| The page has an unload handler in the main frame. | Actionable |
| Pages with cache-control:no-store header cannot enter back/forward cache. | Actionable |
| The page has an unload handler in a sub frame. | Actionable |
| Pages whose main resource has cache-control:no-store cannot enter back/forward cache. | Not actionable |
| Back/forward cache is disabled because some JavaScript network request received resource with Cache-Control: no-store header. | Not actionable |
| An iframe on the page started a navigation that did not complete. | Not actionable |
Minifying JavaScript files can reduce payload sizes and script parse time. Learn how to minify JavaScript.
Performance issues directly impact user engagement and conversion rates.
| URL | Transfer Size | Est Savings |
|---|---|---|
| cdn.taboola.com/libtrc/gannett-network/loader.js | 382.9 KiB | 75.7 KiB |
Reduce unused rules from stylesheets and defer CSS not used for above-the-fold content to decrease bytes consumed by network activity. Learn how to reduce unused CSS.
Performance issues directly impact user engagement and conversion rates.
| URL | Transfer Size | Est Savings |
|---|---|---|
| .trc_rbox_container { direction: ltr; text-align: left; } … | 21.4 KiB | 17.5 KiB |
| :root { --cm-video-brand-primary: var(--yb-grape-jelly, #7e1fff); --cm-video-brand-secondary: v… | 16.0 KiB | 15.5 KiB |
Reduce unused JavaScript and defer loading scripts until they are required to decrease bytes consumed by network activity. Learn how to reduce unused JavaScript.
Multi-megabyte JavaScript bundles delay every interactive feature on the page.
This is the Lighthouse audit fired when too much JS is shipped relative to what executes. The fix isn't a config flag — it requires bundle analysis (webpack-bundle-analyzer, rollup-plugin-visualizer), splitting routes into chunks, lazy-loading off-screen components, and removing unused dependencies. Fundamentally different from minification: minifying reduces byte count, this reduces what's downloaded at all.
Source: Google web.dev / Lighthouse
Large network payloads cost users real money and are highly correlated with long load times. Learn how to reduce payload sizes.
Performance issues directly impact user engagement and conversion rates.
More information about the performance of your application. These numbers don't directly affect the Performance score.
These checks highlight opportunities to improve the accessibility of your web app. Automatic detection can only detect a subset of issues and does not guarantee the accessibility of your web app, so manual testing is also encouraged.
Using ARIA attributes in roles where they are prohibited can mean that important information is not communicated to users of assistive technologies. Learn more about prohibited ARIA roles.
Performance issues directly impact user engagement and conversion rates.
| Failing Elements |
|---|
Smithsonian National Zoo debuts Linh Mai, the first Asian elephant calf born th… div.gnt_pr > div.gnt_m > aside.gnt_em > div.gnt_em_vb |
News section content body > main.gnt_cw > div.gnt_pr > gnt-lb |
Sports section content body > main.gnt_cw > div.gnt_pr > gnt-lb |
Things To Do section content body > main.gnt_cw > div.gnt_pr > gnt-lb |
Opinion section content body > main.gnt_cw > div.gnt_pr > gnt-lb |
These are opportunities to improve the usage of ARIA in your application which may enhance the experience for users of assistive technology, like a screen reader.
Link text (and alternate text for images, when used as links) that is discernible, unique, and focusable improves the navigation experience for screen reader users. Learn how to make links accessible.
Performance issues directly impact user engagement and conversion rates.
| Failing Elements |
|---|
body > header.gnt_n > div.gnt_n_sm > a.gnt_n_sm_a body > header.gnt_n > div.gnt_n_sm > a.gnt_n_sm_a |
These are opportunities to improve the semantics of the controls in your application. This may enhance the experience for users of assistive technology, like a screen reader.
Visible text labels that do not match the accessible name can result in a confusing experience for screen reader users. Learn more about accessible names.
Performance issues directly impact user engagement and conversion rates.
| Failing Elements |
|---|
Ad span.video-label-box > span.branding > div.logoDiv > a.trc_desktop_disclosure_link |
Deprecated APIs will eventually be removed from the browser. Learn more about deprecated APIs.
Performance issues directly impact user engagement and conversion rates.
| Deprecation / Warning | Source |
|---|---|
| Topics | |
| SharedStorage | /pagead/managed/js/activeview/current/ufs_web_display.js line 252, col 234 |
| Unload event listeners are deprecated and will be removed. | cdn.adnxs.com/v/s/252/trk.js line 559, col 5595 |
Errors logged to the console indicate unresolved problems. They can come from network request failures and other browser concerns. Learn more about this errors in console diagnostic audit
Performance issues directly impact user engagement and conversion rates.
| Source | Description |
|---|---|
Access to fetch at 'https://rp.liadm.com/p?aid=a-047k&pu=https%3A%2F%2Fwww.indystar.com%2F&ext_gannett=42d561dc-6bd7-40cc-8f36-88eefdf3dcf3&n3pc=true' from origin 'https://www.indystar.com' has been blocked by CORS policy: No 'Access-Control-Allow-Origin' header is present on the requested resource. | |
Failed to load resource: net::ERR_FAILED | |
Failed to load resource: net::ERR_NAME_NOT_RESOLVED | |
Failed to load resource: the server responded with a status of 400 () | |
Failed to load resource: the server responded with a status of 406 () | |
Object | |
Refused to execute script from 'https://cm.g.doubleclick.net/pixel?google_nid=contextweb&google_cm=&google_sc=&google_hm=RmNJQ0twMUthS0x4b0lPMGZwYmxDUQ&gdpr=&gdpr_consent=&google_tc=' because its MIME type ('image/png') is not executable. |
These checks ensure that your page is following basic search engine optimization advice. There are many additional factors Lighthouse does not score here that may affect your search ranking, including performance on Core Web Vitals. Learn more about Google Search Essentials.
Search engines may use `href` attributes on links to crawl websites. Ensure that the `href` attribute of anchor elements links to an appropriate destination, so more pages of the site can be discovered. Learn how to make links crawlable
Performance issues directly impact user engagement and conversion rates.
| Uncrawlable Link |
|---|
Image for Taboola Advertising Unit div#rbox-h2v > div#internal_trc_292103263 > div.videoCube > a.item-thumbnail-href |
Click here for more information
Ad div#rbox-h2v > div#internal_trc_292103263 > div.videoCube > a.item-label-href |
To appear in search results, crawlers need access to your app.
Send Feedback