Audit overview
3 categories need attention: Security, and 2 others.
Fix Priority Matrix
5 findingsQuick Wins
2High impact, low effort — start here.
Strategic
3High impact, requires investment.
Easy Improvements
0Small gains, minimal effort.
Nothing in this quadrant — good news.
Deprioritize
0Low impact, high effort — do last.
Nothing in this quadrant — good news.
Screenshots
Top Priorities (5)
Content-Security-Policy header is missing
Without a CSP, a single XSS bug can exfiltrate everything your users type — including credentials.
HSTS header is missing
Without HSTS, a network attacker can downgrade the very first connection to HTTP and steal the user's session.
No Content-Security-Policy header found
Without a CSP, a single XSS bug can exfiltrate everything users type — credentials, payment data, session tokens.
1 image(s) missing alt attribute
Each image without alt text is a WCAG 1.1.1 failure — invisible to screen-reader users, lost from Google Image Search.
Soft 404: server returns HTTP 200 for non-existent pages
Soft 404s (HTTP 200 for missing pages) confuse Google — it indexes the 'not found' page as real content and ranks it.
Business case
What fixing the audit's findings is worth -- and what ignoring them keeps costing.
Return on investment
€701 investment → €11,049/month returns + EUR 120,500,000 risk avoided
Figures combine localized regulatory fine ceilings, search/conversion value priced against local CPC, and bandwidth waste estimates. Results depend on implementation quality and audience composition. Not legal or financial advice.
Conversion barriers
8 barrier(s) likely increasing bounce by ~31%.
- Page takes 15.2s to loadUsers abandon at ~3s — you're 12.7s over the 2.5s threshold→ Optimize render-blocking resources, preload the hero image, and compress images
- Page feels frozen for 710msClicks on the primary CTA are ignored while JavaScript runs→ Break up long tasks; defer non-critical JavaScript to post-hydration
- Severe layout shift during page loadUsers mis-click when content jumps — converting intent into frustration→ Reserve space for images, ads, and embeds with explicit width/height
- No HSTS headerReturning visitors are briefly exposed to downgrade attacks on first request→ Set Strict-Transport-Security: max-age=31536000; includeSubDomains
- No Content-Security-Policy headerHigher XSS blast radius — one compromised script can exfiltrate the checkout form→ Ship a reporting-only CSP first, then enforce once violations are clean
Preliminary CRO audit — each barrier links to the tab with detailed analysis.
Remediation cost
Start here for the best return on investment
Cost by category
Cost by effort level
Adjust assumptions
Team composition
Multiplier applied to dev hours to reflect QA, design, and PM overhead. Use Dev only for solo work; Full team for projects with formal review processes.
Rates reflect fully-loaded developer cost including overhead
Warning:Cost of inaction
Compliance Risk
€120.500.000
- No privacy policy link detectedGDPR: EUR 10.000 – EUR 20.000.000
- 2 advertising/retargeting trackers detectedGDPR: EUR 10.000 – EUR 20.000.000
- Trackers detected but no cookie policy foundGDPR: EUR 5.000 – EUR 10.000.000
Bounce-Rate Cost
€11.048 /mo
+31.4pp bounce · ~3,140 lost visitors/mo
CPC: EUR 3.52
Bandwidth Waste
€0,89 /mo
12049.7 MB/mo × 0.074 EUR/GB
- Optimize transfer: save ~1.2 MB per page loadSaves €0,89/mo
Compliance figures represent the statutory maximum fine for the most severe triggered category, capped per regulation — not the sum of per-finding penalties. Based on published regulatory fine ranges. This is not legal advice.
Unique monthly visitors from your analytics
Purchases, signups, or key actions
Optional — for revenue estimation
more engaged visitors from reduced bounce
Fix 5 critical issues to capture this value
How this is calculated
Based on Google/Deloitte research ("Milliseconds Make Millions") showing a ~7% bounce rate increase per additional second of LCP above the 2.5s "Good" threshold.
Your site's LCP: → estimated after fixes.
These are estimates based on industry research — actual results vary
Your data stays in your browser — nothing is sent to our servers
Lighthouse
Mobile
First Contentful Paint First Contentful Paint — how long until the browser renders the first piece of content. Under 1.8s is good.
9.82 s
Largest Contentful Paint Largest Contentful Paint — how long until the largest visible element loads. Under 2.5s is good.
15.22 s
Total Blocking Time Total Blocking Time — total time the main thread was blocked, preventing user input. Under 200ms is good.
710 ms
Cumulative Layout Shift Cumulative Layout Shift — measures visual stability. How much the page layout shifts during loading. Under 0.1 is good.
0.468
Speed Index Speed Index — how quickly content is visually displayed during load. Under 3.4s is good.
9.82 s
Time to Interactive Time to Interactive — how long until the page is fully interactive and responds to user input. Under 3.8s is good.
24.39 s
Desktop
First Contentful Paint First Contentful Paint — how long until the browser renders the first piece of content. Under 1.8s is good.
2.65 s
Largest Contentful Paint Largest Contentful Paint — how long until the largest visible element loads. Under 2.5s is good.
4.13 s
Total Blocking Time Total Blocking Time — total time the main thread was blocked, preventing user input. Under 200ms is good.
18 ms
Cumulative Layout Shift Cumulative Layout Shift — measures visual stability. How much the page layout shifts during loading. Under 0.1 is good.
0.160
Speed Index Speed Index — how quickly content is visually displayed during load. Under 3.4s is good.
2.65 s
Time to Interactive Time to Interactive — how long until the page is fully interactive and responds to user input. Under 3.8s is good.
4.14 s
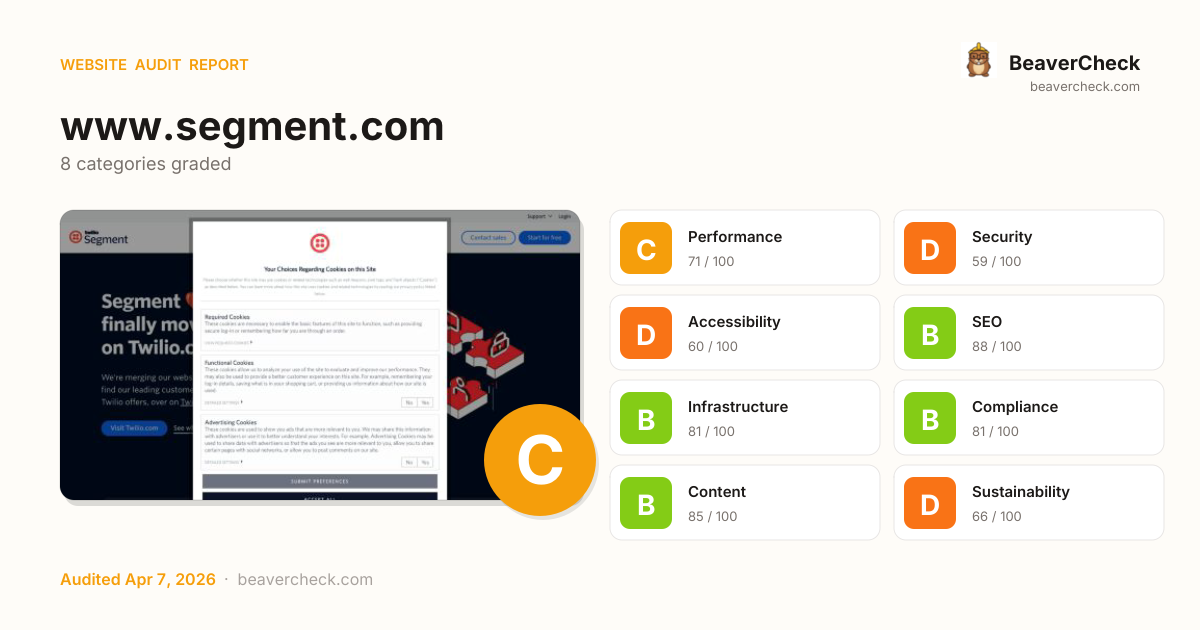
Categories
8Performance
All checks pass
Security
Content-Security-Policy header is missing
Accessibility
1 image(s) missing alt attribute
SEO
All checks pass
Infrastructure
All checks pass
Compliance
All checks pass
Content
All checks pass
Sustainability
All checks pass
How you compare
Where this site stands against peers running the same stack.
Top 10% of Amazon Route 53 sites score 75+ on Security; you're at 59 — closing this gap is the highest-leverage improvement.
Top 10% of core-js sites score 75+ on Security; you're at 59 — closing this gap is the highest-leverage improvement.
Technology stack
Amazon Route 53, with Nginx CDN
Stack Architecture
 Adobe Experience Platform Launch
  Facebook Pixel 2.9.291
 Google Analytics
  Google Tag Manager
  Linkedin Insight Tag
  Microsoft Advertising
  VWO
VWO  Yahoo Advertising
  Open Graph Proofpoint
  Segment 1.81.0
 TrustArc
  Wistia
  ZURB Foundation
  core-js 3.32.2
 jQuery 1.12.4
 Nginx
Nginx All Detected Technologies (21)
Nginx is a web server that can also be used as a reverse proxy, load balancer, mail proxy and HTTP cache.
Open Graph is a protocol that is used to integrate any web page into the social graph.
Segment is a customer data platform (CDP) that helps you collect, clean, and control your customer data.
TrustArc provides software and services to help corporations update their privacy management processes so they comply with government laws and best practices.
Wistia is designed exclusively to serve companies using video on their websites for marketing, support, and sales.
Zurb Foundation is used to prototype in the browser. Allows rapid creation of websites or applications while leveraging mobile and responsive technology. The front end framework is the collection of HTML, CSS, and Javascript containing design patterns.
core-js is a modular standard library for JavaScript, with polyfills for cutting-edge ECMAScript features.
jQuery is a JavaScript library which is a free, open-source software designed to simplify HTML DOM tree traversal and manipulation, as well as event handling, CSS animation, and Ajax.
Adobe Experience Cloud Launch is an extendable tag management solution for Adobe Experience Cloud, Adobe Experience Platform, and other applications.
Facebook pixel is an analytics tool that allows you to measure the effectiveness of your advertising.
Google Analytics is a free web analytics service that tracks and reports website traffic.
Google Tag Manager is a tag management system (TMS) that allows you to quickly and easily update measurement codes and related code fragments collectively known as tags on your website or mobile app.
LinkedIn Insight Tag is a lightweight JavaScript tag that powers conversion tracking, website audiences, and website demographics.
Microsoft Advertising is an online advertising platform developed by Microsoft.
VWO is a website testing and conversion optimisation platform.
Yahoo Advertising includes a comprehensive suite of web, mobile, and video ad products across native, audience, and premium display, which are accessible through a new buying platform.
Observations (3)
No build tool detected
A framework (Amazon Route 53) was detected but no bundler was identified. The build tool may not be detectable from output patterns, or the site may use the framework's built-in bundler.
jQuery version may be outdated
Detected jQuery 1.12.4. The current major version is 3. Consider updating for security patches and new features.
Complex technology stack detected
21 technologies identified. A complex stack increases maintenance burden and attack surface. Consider whether all components are actively needed.
Show your score
Drop this badge on your README, marketing site, or status page. It auto-updates every time the audit re-runs and links back to this report.
This badge auto-updates with your latest scan result.
[](https://beavercheck.com/results/eec7c164-6808-4c4c-197f-f6c5a4fac0e9)<a href="https://beavercheck.com/results/eec7c164-6808-4c4c-197f-f6c5a4fac0e9"><img src="https://beavercheck.com/badge?url=https%3A%2F%2Fwww.segment.com" alt="BeaverCheck Score"></a>https://beavercheck.com/badge?url=https%3A%2F%2Fwww.segment.comExport & share
Download the audit, share with your team, or grab a fix plan ready to copy into your tracker.
Copies markdown to clipboard
Fix Plan
Three-week roadmap to ship the audit's findings, with one-click copy targets for your tracker.
Three-week fix plan
2 sprints · 8h total → projected C (79)
Sprint 1: Quick Wins
+4Highest ROI — low effort, high impact
- · HSTS header is missing
- · Soft 404: server returns HTTP 200 for non-existent pages
Sprint 2: Core Fixes
+5Medium effort, high structural impact
- · 1 image(s) missing alt attribute
- · Content-Security-Policy header is missing
- · No Content-Security-Policy header found