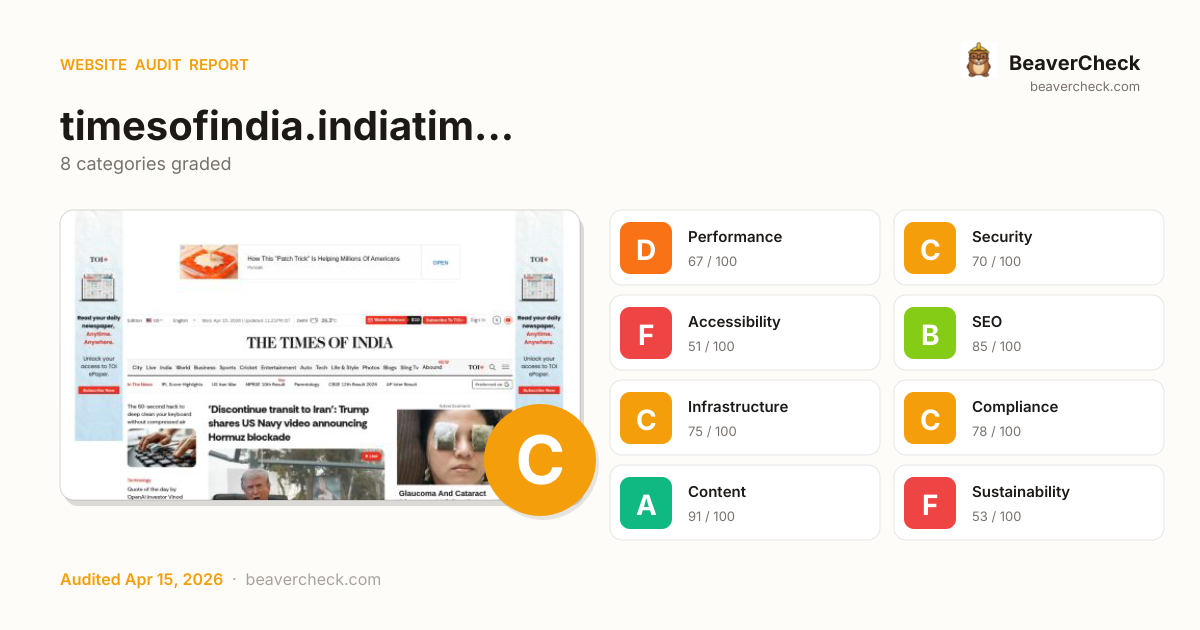
Mobile 375 × 812

Desktop 1440 × 900

Score: 70 / 100
Based on 8 categories, 0 sections
Room to improve — your 2.7s load time is above Google's 2.5s 'Good' threshold.
Good foundation, but a few gaps could be exploited.
Several issues make your site difficult for assistive technology users.
Well-optimized for search — your content is discoverable.
Good server performance with room for optimization.
Mostly compliant — a few items need attention.
Rich content metadata — your pages look great everywhere.
Heavier than average — reducing page weight saves energy and bandwidth.
The overall score is a weighted average of individual category scores. Categories with more impact on user experience and security carry more weight.
Weights reflect general web best practices. Individual needs may differ.
Page weighs 27.6 MB (8.1 MB transferred)
Performance issues directly impact user engagement and conversion rates.
1 control(s) without accessible label
Accessibility issues exclude users with disabilities — up to 15% of your potential audience.
3 link(s) with no accessible text
Accessibility issues exclude users with disabilities — up to 15% of your potential audience.
34 image-only link(s) without alt text
Accessibility issues exclude users with disabilities — up to 15% of your potential audience.
No <main> landmark found
Accessibility issues exclude users with disabilities — up to 15% of your potential audience.
High impact, low effort — start here.
Nothing in this quadrant — good news.
High impact, requires investment.
Small gains, minimal effort.
Nothing in this quadrant — good news.
Low impact, high effort — do last.
Nothing in this quadrant — good news.
[](https://beavercheck.com/results/f3e2314d-b848-4fab-8a1f-47e03ec65c76)<a href="https://beavercheck.com/results/f3e2314d-b848-4fab-8a1f-47e03ec65c76"><img src="https://beavercheck.com/badge?url=https%3A%2F%2Ftimesofindia.indiatimes.com" alt="BeaverCheck Score"></a>https://beavercheck.com/badge?url=https%3A%2F%2Ftimesofindia.indiatimes.comThis badge auto-updates with your latest scan result.
Your site performs reasonably well, but a few targeted fixes could meaningfully improve results. Your LCP of 2.7s exceeds Google's 2.5s 'Good' threshold and the 1 performance issue below directly contributes to it. Accessibility issues exclude users who rely on assistive technology — an estimated 15% of your potential audience. Addressing the critical issues below would have the most immediate impact on your conversion rate.
€680 investment → €376/month returns + EUR 120,500,000 risk avoided
€680
8h · 5 findings
€376 /mo
~€4,510 / year
EUR 120,500,000
if kept compliant
Figures combine localized regulatory fine ceilings, search/conversion value priced against local CPC, and bandwidth waste estimates. Results depend on implementation quality and audience composition. Not legal or financial advice.
8.0 developer hours at €85/hr
Based on European Union rates (€85/hr)
€10,041,669 / month at risk
~€120,500,023 / year if left unfixed
€120,500,000
+9 more
€1.89 /mo
25548.4 MB/mo × 0.074 EUR/GB
Compliance figures represent the statutory maximum fine for the most severe triggered category, capped per regulation — not the sum of per-finding penalties. Based on published regulatory fine ranges. This is not legal advice.
Unique monthly visitors from your analytics
Purchases, signups, or key actions
Optional — for revenue estimation
more engaged visitors from reduced bounce
Fix 5 critical issues to capture this value
Based on Google/Deloitte research ("Milliseconds Make Millions") showing a ~7% bounce rate increase per additional second of LCP above the 2.5s "Good" threshold.
Your site's LCP: → estimated after fixes.
These are estimates based on industry research — actual results vary
Your data stays in your browser — nothing is sent to our servers
Thanks for your feedback!
We'll use a cached audit if available, or offer to scan.
Industry-standard audits powered by Google Lighthouse.
Key metrics that affect user experience.
First Contentful Paint First Contentful Paint — how long until the browser renders the first piece of content. Under 1.8s is good.
2.44 s
Largest Contentful Paint Largest Contentful Paint — how long until the largest visible element loads. Under 2.5s is good.
2.74 s
Total Blocking Time Total Blocking Time — total time the main thread was blocked, preventing user input. Under 200ms is good.
33.00 s
Cumulative Layout Shift Cumulative Layout Shift — measures visual stability. How much the page layout shifts during loading. Under 0.1 is good.
0.004
Speed Index Speed Index — how quickly content is visually displayed during load. Under 3.4s is good.
15.13 s
Time to Interactive Time to Interactive — how long until the page is fully interactive and responds to user input. Under 3.8s is good.
83.42 s
Audit breakdown by category with detailed findings.
Remove large, duplicate JavaScript modules from bundles to reduce unnecessary bytes consumed by network activity.
Performance issues directly impact user engagement and conversion rates.
Polyfills and transforms enable older browsers to use new JavaScript features. However, many aren't necessary for modern browsers. Consider modifying your JavaScript build process to not transpile Baseline features, unless you know you must support older browsers. Learn why most sites can deploy ES6+ code without transpiling
Shipping ES5 transpiled code to modern browsers wastes bytes — every user with an evergreen browser pays for compatibility you don't need.
Most users today run browsers that natively support ES6+, async/await, optional chaining, and the rest of modern JavaScript. Transpiling to ES5 'just in case' adds 20-40% to your bundle for no benefit. Configure your build to target a modern browserslist, or ship a differential bundle pair (modern + legacy) with the module/nomodule pattern.
Source: Google web.dev / Lighthouse
3rd party code can significantly impact load performance. Reduce and defer loading of 3rd party code to prioritize your page's content.
Performance issues directly impact user engagement and conversion rates.
Your first network request is the most important. Reduce its latency by avoiding redirects, ensuring a fast server response, and enabling text compression.
Performance issues directly impact user engagement and conversion rates.
A forced reflow occurs when JavaScript queries geometric properties (such as offsetWidth) after styles have been invalidated by a change to the DOM state. This can result in poor performance. Learn more about forced reflows and possible mitigations.
Performance issues directly impact user engagement and conversion rates.
Optimize LCP by making the LCP image discoverable from the HTML immediately, and avoiding lazy-loading
Performance issues directly impact user engagement and conversion rates.
Avoid chaining critical requests by reducing the length of chains, reducing the download size of resources, or deferring the download of unnecessary resources to improve page load.
Performance issues directly impact user engagement and conversion rates.
A long cache lifetime can speed up repeat visits to your page. Learn more about caching.
Performance issues directly impact user engagement and conversion rates.
Reducing the download time of images can improve the perceived load time of the page and LCP. Learn more about optimizing image size
Performance issues directly impact user engagement and conversion rates.
| URL | Resource Size | Est Savings | |
|---|---|---|---|
Article image for: Why heart attacks are striking gym-goers in their 30s, 40s a… a.Dfswf > div.GZ7xU > div.foi4A > img | /thumb/128878627.jpg?photoid=128878627&imgsize=2903661&wi... | 22.0 KiB | 20.2 KiB |
HTTP/2 and HTTP/3 offer many benefits over HTTP/1.1, such as multiplexing. Learn more about using modern HTTP.
Performance issues directly impact user engagement and conversion rates.
These insights are also available in the Chrome DevTools Performance Panel - record a trace to view more detailed information.
Time to Interactive is the amount of time it takes for the page to become fully interactive. Learn more about the Time to Interactive metric.
Performance issues directly impact user engagement and conversion rates.
The maximum potential First Input Delay that your users could experience is the duration of the longest task. Learn more about the Maximum Potential First Input Delay metric.
Performance issues directly impact user engagement and conversion rates.
Redirects introduce additional delays before the page can be loaded. Learn how to avoid page redirects.
Performance issues directly impact user engagement and conversion rates.
| URL | Time Spent |
|---|---|
| timesofindia.indiatimes.com/ | 779 ms |
| timesofindia.indiatimes.com/us | 0.0 ms |
Consider reducing the time spent parsing, compiling, and executing JS. You may find delivering smaller JS payloads helps with this. Learn how to reduce Javascript execution time.
Performance issues directly impact user engagement and conversion rates.
Consider reducing the time spent parsing, compiling and executing JS. You may find delivering smaller JS payloads helps with this. Learn how to minimize main-thread work
Performance issues directly impact user engagement and conversion rates.
| Category | Time Spent |
|---|---|
| Script Evaluation | 43.7 s |
| Other | 21.2 s |
| Style & Layout | 13.6 s |
| Rendering | 4.1 s |
| Script Parsing & Compilation | 2.7 s |
| Garbage Collection | 1.2 s |
| Parse HTML & CSS | 799 ms |
Many navigations are performed by going back to a previous page, or forwards again. The back/forward cache (bfcache) can speed up these return navigations. Learn more about the bfcache
Performance issues directly impact user engagement and conversion rates.
| Failure reason | Failure type |
|---|---|
| Pages with cache-control:no-store header cannot enter back/forward cache. | Actionable |
| Pages whose main resource has cache-control:no-store cannot enter back/forward cache. | Not actionable |
| Back/forward cache is disabled because some JavaScript network request received resource with Cache-Control: no-store header. | Not actionable |
| An iframe on the page started a navigation that did not complete. | Not actionable |
Reduce unused rules from stylesheets and defer CSS not used for above-the-fold content to decrease bytes consumed by network activity. Learn how to reduce unused CSS.
Performance issues directly impact user engagement and conversion rates.
| URL | Transfer Size | Est Savings |
|---|---|---|
| assets.toiimg.com/assets/24857.e57cf512.chunk.css | 86.7 KiB | 85.5 KiB |
| assets.toiimg.com/assets/67109.48ca61d7.chunk.css | 31.3 KiB | 31.3 KiB |
| assets.toiimg.com/assets/33175.bc6334e8.chunk.css | 19.9 KiB | 19.9 KiB |
| assets.toiimg.com/assets/17189.327ef632.chunk.css | 19.1 KiB | 18.4 KiB |
| loyalty.joinabound.com/widget/static/dist/css/app.css?v=11 | 14.7 KiB | 14.5 KiB |
| assets.toiimg.com/assets/91667.a7bbe87a.chunk.css | 14.3 KiB | 14.3 KiB |
| assets.toiimg.com/assets/6129.a9085c79.chunk.css | 13.8 KiB | 12.5 KiB |
| assets.toiimg.com/assets/38154.f15f27d8.chunk.css | 12.7 KiB | 11.7 KiB |
| .wh100,.cpl-c,.cpl-v{width:100%;height:100%} … | 12.6 KiB | 11.6 KiB |
| assets.toiimg.com/assets/42922.91db0891.chunk.css | 11.5 KiB | 11.5 KiB |
| assets.toiimg.com/assets/63810.d7b716db.chunk.css | 11.0 KiB | 10.9 KiB |
| assets.toiimg.com/assets/24429.307cac93.chunk.css | 10.7 KiB | 10.1 KiB |
Reduce unused JavaScript and defer loading scripts until they are required to decrease bytes consumed by network activity. Learn how to reduce unused JavaScript.
Multi-megabyte JavaScript bundles delay every interactive feature on the page.
This is the Lighthouse audit fired when too much JS is shipped relative to what executes. The fix isn't a config flag — it requires bundle analysis (webpack-bundle-analyzer, rollup-plugin-visualizer), splitting routes into chunks, lazy-loading off-screen components, and removing unused dependencies. Fundamentally different from minification: minifying reduces byte count, this reduces what's downloaded at all.
Source: Google web.dev / Lighthouse
Large network payloads cost users real money and are highly correlated with long load times. Learn how to reduce payload sizes.
Performance issues directly impact user engagement and conversion rates.
More information about the performance of your application. These numbers don't directly affect the Performance score.
These checks highlight opportunities to improve the accessibility of your web app. Automatic detection can only detect a subset of issues and does not guarantee the accessibility of your web app, so manual testing is also encouraged.
Informative elements should aim for short, descriptive alternate text. Decorative elements can be ignored with an empty alt attribute. Learn more about the `alt` attribute.
Performance issues directly impact user engagement and conversion rates.
| Failing Elements |
|---|
div.cpl-c-top > div.cpl-c-lftTop > div.cpl-c-topLt2 > img div.cpl-c-top > div.cpl-c-lftTop > div.cpl-c-topLt2 > img |
These are opportunities to improve the semantics of the controls in your application. This may enhance the experience for users of assistive technology, like a screen reader.
Disabling zooming is problematic for users with low vision who rely on screen magnification to properly see the contents of a web page. Learn more about the viewport meta tag.
Performance issues directly impact user engagement and conversion rates.
| Failing Elements |
|---|
head > meta head > meta |
One main landmark helps screen reader users navigate a web page. Learn more about landmarks.
Performance issues directly impact user engagement and conversion rates.
| Failing Elements |
|---|
html.no-js html.no-js |
These items highlight common accessibility best practices.
Image natural dimensions should be proportional to the display size and the pixel ratio to maximize image clarity. Learn how to provide responsive images.
Performance issues directly impact user engagement and conversion rates.
| URL | Displayed size | Actual size | Expected size | |
|---|---|---|---|---|
Floating Wallet div > div.tpwidget > div > img.floatingWallet | loyalty.joinabound.com/widget/static/dist/images/floatingBtnnew.png | 22 x 22 | 23 x 23 | 33 x 33 |
Deprecated APIs will eventually be removed from the browser. Learn more about deprecated APIs.
Performance issues directly impact user engagement and conversion rates.
| Deprecation / Warning | Source |
|---|---|
| Topics | assets.toiimg.com/assets/prebid/js/til_prebid_new.js?v=25 line 11, col 91943 |
| SharedStorage | /pagead/managed/js/activeview/current/ufs_web_display.js line 252, col 234 |
Errors logged to the console indicate unresolved problems. They can come from network request failures and other browser concerns. Learn more about this errors in console diagnostic audit
Performance issues directly impact user engagement and conversion rates.
| Source | Description |
|---|---|
accounts.google.com/gsi/client line 85, col 88 | [GSI_LOGGER]: FedCM get() rejects with AbortError: signal is aborted without reason |
accounts.google.com/gsi/client line 85, col 88 | [GSI_LOGGER]: FedCM get() rejects with NetworkError: Error retrieving a token. |
c.amazon-adsystem.com/aax2/apstag.js line 4, col 3691 | Error: `apstag.init` was called multiple times with different pubIDs (5025 then 5d8ed25e-57cc-441a-b62a-127b34faae4e)
at V (https://c.amazon-adsystem.com/aax2/apstag.js:5:70936)
at Ot (https://c.amazon-adsystem.com/aax2/apstag.js:5:103869)
at vt (https://c.amazon-adsystem.com/aax2/apstag.js:5:104012)
at https://c.amazon-adsystem.com/aax2/apstag.js:5:176391
at Object.init (https://c.amazon-adsystem.com/aax2/apstag.js:5:4265)
at initAPSTag (https://altstar.tech/default_times_internet/js/ads.min.js:1:31262)
at init (https://altstar.tech/default_times_internet/js/ads.min.js:1:60223)
at https://altstar.tech/default_times_internet/js/ads.min.js:1:67544
at https://altstar.tech/default_times_internet/js/ads.min.js:1:67575
at https://altstar.tech/default_times_internet/js/ads.min.js:1:67768 |
Not signed in with the identity provider. | |
tvid.in/r/spl.toimweb5t9tCpb7nb5q6jUb.light.js line 3, col 105706 | Refused to get unsafe header "geo" |
These checks ensure that your page is following basic search engine optimization advice. There are many additional factors Lighthouse does not score here that may affect your search ranking, including performance on Core Web Vitals. Learn more about Google Search Essentials.
Informative elements should aim for short, descriptive alternate text. Decorative elements can be ignored with an empty alt attribute. Learn more about the `alt` attribute.
Performance issues directly impact user engagement and conversion rates.
| Failing Elements |
|---|
div.cpl-c-top > div.cpl-c-lftTop > div.cpl-c-topLt2 > img div.cpl-c-top > div.cpl-c-lftTop > div.cpl-c-topLt2 > img |
Format your HTML in a way that enables crawlers to better understand your app’s content.
Industry-standard audits powered by Google Lighthouse. — Desktop
Key metrics that affect user experience. — Desktop
First Contentful Paint First Contentful Paint — how long until the browser renders the first piece of content. Under 1.8s is good.
695 ms
Largest Contentful Paint Largest Contentful Paint — how long until the largest visible element loads. Under 2.5s is good.
989 ms
Total Blocking Time Total Blocking Time — total time the main thread was blocked, preventing user input. Under 200ms is good.
3.52 s
Cumulative Layout Shift Cumulative Layout Shift — measures visual stability. How much the page layout shifts during loading. Under 0.1 is good.
0.001
Speed Index Speed Index — how quickly content is visually displayed during load. Under 3.4s is good.
5.40 s
Time to Interactive Time to Interactive — how long until the page is fully interactive and responds to user input. Under 3.8s is good.
22.82 s
Audit breakdown by category with detailed findings.
Remove large, duplicate JavaScript modules from bundles to reduce unnecessary bytes consumed by network activity.
Performance issues directly impact user engagement and conversion rates.
Polyfills and transforms enable older browsers to use new JavaScript features. However, many aren't necessary for modern browsers. Consider modifying your JavaScript build process to not transpile Baseline features, unless you know you must support older browsers. Learn why most sites can deploy ES6+ code without transpiling
Shipping ES5 transpiled code to modern browsers wastes bytes — every user with an evergreen browser pays for compatibility you don't need.
Most users today run browsers that natively support ES6+, async/await, optional chaining, and the rest of modern JavaScript. Transpiling to ES5 'just in case' adds 20-40% to your bundle for no benefit. Configure your build to target a modern browserslist, or ship a differential bundle pair (modern + legacy) with the module/nomodule pattern.
Source: Google web.dev / Lighthouse
3rd party code can significantly impact load performance. Reduce and defer loading of 3rd party code to prioritize your page's content.
Performance issues directly impact user engagement and conversion rates.
Your first network request is the most important. Reduce its latency by avoiding redirects, ensuring a fast server response, and enabling text compression.
Performance issues directly impact user engagement and conversion rates.
A forced reflow occurs when JavaScript queries geometric properties (such as offsetWidth) after styles have been invalidated by a change to the DOM state. This can result in poor performance. Learn more about forced reflows and possible mitigations.
Performance issues directly impact user engagement and conversion rates.
Optimize LCP by making the LCP image discoverable from the HTML immediately, and avoiding lazy-loading
Performance issues directly impact user engagement and conversion rates.
Avoid chaining critical requests by reducing the length of chains, reducing the download size of resources, or deferring the download of unnecessary resources to improve page load.
Performance issues directly impact user engagement and conversion rates.
A long cache lifetime can speed up repeat visits to your page. Learn more about caching.
Performance issues directly impact user engagement and conversion rates.
Reducing the download time of images can improve the perceived load time of the page and LCP. Learn more about optimizing image size
Performance issues directly impact user engagement and conversion rates.
| URL | Resource Size | Est Savings | |
|---|---|---|---|
div.WQTo9 > a.MoBJ2 > div.ctih_ > img div.WQTo9 > a.MoBJ2 > div.ctih_ > img | /thumb/imgsize-395934,msid-130270549,width-600,resizemode... | 201.1 KiB | 197.3 KiB |
a.border_color > div.mSNeX > div.Ik2M6 > img a.border_color > div.mSNeX > div.Ik2M6 > img | /thumb/128878627.jpg?photoid=128878627&imgsize=2903661&wi... | 36.0 KiB | 33.3 KiB |
div.v19rq > a > div.gn0Wk > img div.v19rq > a > div.gn0Wk > img | imagesnep.admaster.cc/ML/2183d772b999573326d88af9bc9feeff__scv1__622x368.webp | 19.5 KiB | 18.3 KiB |
head > link head > link | imagesnep.admaster.cc/ML/2bd47ba094c687c79eb98051790166a2__scv1__622x368.webp | 13.0 KiB | 9.3 KiB |
HTTP/2 and HTTP/3 offer many benefits over HTTP/1.1, such as multiplexing. Learn more about using modern HTTP.
Performance issues directly impact user engagement and conversion rates.
These insights are also available in the Chrome DevTools Performance Panel - record a trace to view more detailed information.
Time to Interactive is the amount of time it takes for the page to become fully interactive. Learn more about the Time to Interactive metric.
Performance issues directly impact user engagement and conversion rates.
The maximum potential First Input Delay that your users could experience is the duration of the longest task. Learn more about the Maximum Potential First Input Delay metric.
Performance issues directly impact user engagement and conversion rates.
Redirects introduce additional delays before the page can be loaded. Learn how to avoid page redirects.
Performance issues directly impact user engagement and conversion rates.
| URL | Time Spent |
|---|---|
| timesofindia.indiatimes.com/ | 221 ms |
| timesofindia.indiatimes.com/us | 0.0 ms |
Reduce unused rules from stylesheets and defer CSS not used for above-the-fold content to decrease bytes consumed by network activity. Learn how to reduce unused CSS.
Performance issues directly impact user engagement and conversion rates.
| URL | Transfer Size | Est Savings |
|---|---|---|
| assets.toiimg.com/assets/21182.528c5a1d.chunk.css | 26.7 KiB | 25.4 KiB |
| assets.toiimg.com/assets/26088.126a13b3.chunk.css | 19.9 KiB | 18.5 KiB |
| assets.toiimg.com/assets/74151.1396facd.chunk.css | 17.4 KiB | 16.3 KiB |
| assets.toiimg.com/assets/50827.46a5c3cd.chunk.css | 17.2 KiB | 15.7 KiB |
| assets.toiimg.com/assets/46463.030608ec.chunk.css | 15.3 KiB | 14.1 KiB |
| assets.toiimg.com/assets/24429.307cac93.chunk.css | 10.7 KiB | 10.7 KiB |
Consider reducing the time spent parsing, compiling, and executing JS. You may find delivering smaller JS payloads helps with this. Learn how to reduce Javascript execution time.
Performance issues directly impact user engagement and conversion rates.
Consider reducing the time spent parsing, compiling and executing JS. You may find delivering smaller JS payloads helps with this. Learn how to minimize main-thread work
Performance issues directly impact user engagement and conversion rates.
| Category | Time Spent |
|---|---|
| Script Evaluation | 9.3 s |
| Other | 5.1 s |
| Rendering | 2.6 s |
| Style & Layout | 2.3 s |
| Script Parsing & Compilation | 401 ms |
| Garbage Collection | 116 ms |
| Parse HTML & CSS | 112 ms |
Many navigations are performed by going back to a previous page, or forwards again. The back/forward cache (bfcache) can speed up these return navigations. Learn more about the bfcache
Performance issues directly impact user engagement and conversion rates.
| Failure reason | Failure type |
|---|---|
| Pages with cache-control:no-store header cannot enter back/forward cache. | Actionable |
| Pages whose main resource has cache-control:no-store cannot enter back/forward cache. | Not actionable |
| Back/forward cache is disabled because some JavaScript network request received resource with Cache-Control: no-store header. | Not actionable |
| An iframe on the page started a navigation that did not complete. | Not actionable |
Reduce unused JavaScript and defer loading scripts until they are required to decrease bytes consumed by network activity. Learn how to reduce unused JavaScript.
Multi-megabyte JavaScript bundles delay every interactive feature on the page.
This is the Lighthouse audit fired when too much JS is shipped relative to what executes. The fix isn't a config flag — it requires bundle analysis (webpack-bundle-analyzer, rollup-plugin-visualizer), splitting routes into chunks, lazy-loading off-screen components, and removing unused dependencies. Fundamentally different from minification: minifying reduces byte count, this reduces what's downloaded at all.
Source: Google web.dev / Lighthouse
Large network payloads cost users real money and are highly correlated with long load times. Learn how to reduce payload sizes.
Performance issues directly impact user engagement and conversion rates.
Set an explicit width and height on image elements to reduce layout shifts and improve CLS. Learn how to set image dimensions
Performance issues directly impact user engagement and conversion rates.
| URL | |
|---|---|
div#header-masthead > div.contentwrapper > a > img div#header-masthead > div.contentwrapper > a > img | static.toiimg.com/photo/79638690.cms |
div.v19rq > a > div.gn0Wk > img div.v19rq > a > div.gn0Wk > img | /thumb/47529300.jpg?photoid=47529300&imgsize=11111111&res... |
logo div.HbH_d > div > a.H1kTs > img | static.toiimg.com/thumb/47529300.jpg?photoid=47529300&resizemode=4 |
Wallet Icon div > div.aboundPersisnent > div.aboundWalletWrap > img.aboudwalletIcon | loyalty.joinabound.com/widget/static/dist/images/wallet_logo.png |
More information about the performance of your application. These numbers don't directly affect the Performance score.
These checks highlight opportunities to improve the accessibility of your web app. Automatic detection can only detect a subset of issues and does not guarantee the accessibility of your web app, so manual testing is also encouraged.
Focusable descendents within an `[aria-hidden="true"]` element prevent those interactive elements from being available to users of assistive technologies like screen readers. Learn how `aria-hidden` affects focusable elements.
Performance issues directly impact user engagement and conversion rates.
| Failing Elements |
|---|
Play Dirty
A brutal, funny, and fitfully entertaining romp that never quite li… div.slick-slider > div.slick-list > div.slick-track > div.slick-slide |
These are opportunities to improve the usage of ARIA in your application which may enhance the experience for users of assistive technology, like a screen reader.
Link text (and alternate text for images, when used as links) that is discernible, unique, and focusable improves the navigation experience for screen reader users. Learn how to make links accessible.
Performance issues directly impact user engagement and conversion rates.
| Failing Elements |
|---|
div.header-container > div#header-masthead > div.contentwrapper > a div.header-container > div#header-masthead > div.contentwrapper > a |
These are opportunities to improve the semantics of the controls in your application. This may enhance the experience for users of assistive technology, like a screen reader.
Disabling zooming is problematic for users with low vision who rely on screen magnification to properly see the contents of a web page. Learn more about the viewport meta tag.
Performance issues directly impact user engagement and conversion rates.
| Failing Elements |
|---|
head > meta head > meta |
Touch targets with sufficient size and spacing help users who may have difficulty targeting small controls to activate the targets. Learn more about touch targets.
Performance issues directly impact user engagement and conversion rates.
| Failing Elements |
|---|
div.slick-slider > ul.slick-dots > li.slick-active > button div.slick-slider > ul.slick-dots > li.slick-active > button |
div.slick-slider > ul.slick-dots > li > button div.slick-slider > ul.slick-dots > li > button |
One main landmark helps screen reader users navigate a web page. Learn more about landmarks.
Performance issues directly impact user engagement and conversion rates.
| Failing Elements |
|---|
html.no-js html.no-js |
These items highlight common accessibility best practices.
Deprecated APIs will eventually be removed from the browser. Learn more about deprecated APIs.
Performance issues directly impact user engagement and conversion rates.
| Deprecation / Warning | Source |
|---|---|
| Topics | assets.toiimg.com/assets/prebid/js/til_prebid_new.js?v=25 line 11, col 91943 |
| SharedStorage | /pagead/managed/js/activeview/current/ufs_web_display.js line 252, col 234 |
Errors logged to the console indicate unresolved problems. They can come from network request failures and other browser concerns. Learn more about this errors in console diagnostic audit
Performance issues directly impact user engagement and conversion rates.
| Source | Description |
|---|---|
accounts.google.com/gsi/client line 85, col 88 | [GSI_LOGGER]: FedCM get() rejects with NetworkError: Error retrieving a token. |
Failed to load resource: net::ERR_NAME_NOT_RESOLVED | |
Not signed in with the identity provider. |
These checks ensure that your page is following basic search engine optimization advice. There are many additional factors Lighthouse does not score here that may affect your search ranking, including performance on Core Web Vitals. Learn more about Google Search Essentials.
Descriptive link text helps search engines understand your content. Learn how to make links more accessible.
Performance issues directly impact user engagement and conversion rates.
| Link destination | Link Text |
|---|---|
| timesofindia.indiatimes.com/life-style | More |
Format your HTML in a way that enables crawlers to better understand your app’s content.
Search engines may use `href` attributes on links to crawl websites. Ensure that the `href` attribute of anchor elements links to an appropriate destination, so more pages of the site can be discovered. Learn how to make links crawlable
Performance issues directly impact user engagement and conversion rates.
| Uncrawlable Link |
|---|
Delhi div.mf9HD > div.VsN1w > div.Dsuf0 > a |
To appear in search results, crawlers need access to your app.
Send Feedback