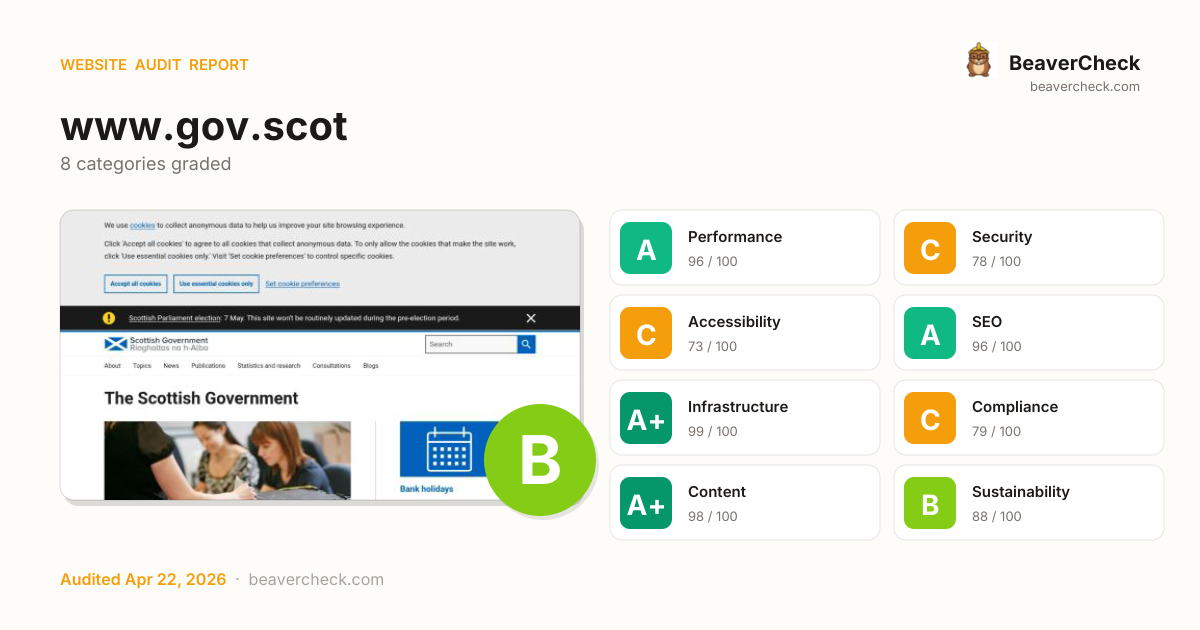
Mobile 375 × 812

Desktop 1440 × 900

Score: 87 / 100
Based on 8 categories, 0 sections
Fast site — your users get a smooth experience.
Good foundation, but a few gaps could be exploited.
Mostly accessible, but some users still face barriers.
Well-optimized for search — your content is discoverable.
Solid infrastructure — fast server responses across the board.
Mostly compliant — a few items need attention.
Rich content metadata — your pages look great everywhere.
Lean and efficient — low environmental impact per visit.
The overall score is a weighted average of individual category scores. Categories with more impact on user experience and security carry more weight.
Weights reflect general web best practices. Individual needs may differ.
Cross-Origin-Embedder-Policy header is missing
Security gaps expose your site and users to attacks, eroding trust.
Cross-Origin-Opener-Policy header is missing
Security gaps expose your site and users to attacks, eroding trust.
External link from fonts.googleapis.com lacks integrity attribute
Security gaps expose your site and users to attacks, eroding trust.
External link from maxcdn.bootstrapcdn.com lacks integrity attribute
Security gaps expose your site and users to attacks, eroding trust.
No DMARC record found
Without DMARC, anyone can send phishing emails using your domain name.
High impact, low effort — start here.
High impact, requires investment.
Small gains, minimal effort.
Nothing in this quadrant — good news.
Low impact, high effort — do last.
Nothing in this quadrant — good news.
[](https://beavercheck.com/results/65400e6d-034b-441e-9802-255010790bc2)<a href="https://beavercheck.com/results/65400e6d-034b-441e-9802-255010790bc2"><img src="https://beavercheck.com/badge?url=https%3A%2F%2Fwww.gov.scot" alt="BeaverCheck Score"></a>https://beavercheck.com/badge?url=https%3A%2F%2Fwww.gov.scotThis badge auto-updates with your latest scan result.
Your site is in great shape. The remaining improvements are refinements rather than critical fixes. Addressing the critical issues below would have the most immediate impact on your user trust.
3 barrier(s) likely increasing bounce by ~13%.
No Content-Security-Policy header
+1% bounceHigher XSS blast radius — one compromised script can exfiltrate the checkout form
Fix: Ship a reporting-only CSP first, then enforce once violations are clean
Severe layout shift during page load
+6% bounceUsers mis-click when content jumps — converting intent into frustration
Fix: Reserve space for images, ads, and embeds with explicit width/height
Content is hard to read
+2% bounceGraduate-level reading difficulty — limits the addressable audience for product or blog pages
Fix: Shorten sentences; replace jargon with plain language; target Flesch ease ≥60
Preliminary CRO audit — each barrier links to the tab with detailed analysis.
€255 investment → €0.07/month returns + EUR 120,500,000 risk avoided
€255
3h · 5 findings
€0.07 /mo
~€0.79 / year
EUR 120,500,000
if kept compliant
€170 — in quick wins — start here for the fastest payback
Figures combine localized regulatory fine ceilings, search/conversion value priced against local CPC, and bandwidth waste estimates. Results depend on implementation quality and audience composition. Not legal or financial advice.
3.0 developer hours at €85/hr
Based on European Union rates (€85/hr)
Start here for the best return on investment
€10,041,667 / month at risk
~€120,500,001 / year if left unfixed
€120,500,000
+3 more
€0.07 /mo
883.2 MB/mo × 0.074 EUR/GB
Compliance figures represent the statutory maximum fine for the most severe triggered category, capped per regulation — not the sum of per-finding penalties. Based on published regulatory fine ranges. This is not legal advice.
Unique monthly visitors from your analytics
Purchases, signups, or key actions
Optional — for revenue estimation
more engaged visitors from reduced bounce
Based on Google/Deloitte research ("Milliseconds Make Millions") showing a ~7% bounce rate increase per additional second of LCP above the 2.5s "Good" threshold.
Your site's LCP: → estimated after fixes.
These are estimates based on industry research — actual results vary
Your data stays in your browser — nothing is sent to our servers
Thanks for your feedback!
We'll use a cached audit if available, or offer to scan.
Industry-standard audits powered by Google Lighthouse.
Key metrics that affect user experience.
First Contentful Paint First Contentful Paint — how long until the browser renders the first piece of content. Under 1.8s is good.
1.81 s
Largest Contentful Paint Largest Contentful Paint — how long until the largest visible element loads. Under 2.5s is good.
1.96 s
Total Blocking Time Total Blocking Time — total time the main thread was blocked, preventing user input. Under 200ms is good.
0 ms
Cumulative Layout Shift Cumulative Layout Shift — measures visual stability. How much the page layout shifts during loading. Under 0.1 is good.
0.633
Speed Index Speed Index — how quickly content is visually displayed during load. Under 3.4s is good.
1.81 s
Time to Interactive Time to Interactive — how long until the page is fully interactive and responds to user input. Under 3.8s is good.
1.96 s
Audit breakdown by category with detailed findings.
Remove large, duplicate JavaScript modules from bundles to reduce unnecessary bytes consumed by network activity.
Performance issues directly impact user engagement and conversion rates.
Polyfills and transforms enable older browsers to use new JavaScript features. However, many aren't necessary for modern browsers. Consider modifying your JavaScript build process to not transpile Baseline features, unless you know you must support older browsers. Learn why most sites can deploy ES6+ code without transpiling
Shipping ES5 transpiled code to modern browsers wastes bytes — every user with an evergreen browser pays for compatibility you don't need.
Most users today run browsers that natively support ES6+, async/await, optional chaining, and the rest of modern JavaScript. Transpiling to ES5 'just in case' adds 20-40% to your bundle for no benefit. Configure your build to target a modern browserslist, or ship a differential bundle pair (modern + legacy) with the module/nomodule pattern.
Source: Google web.dev / Lighthouse
3rd party code can significantly impact load performance. Reduce and defer loading of 3rd party code to prioritize your page's content.
Performance issues directly impact user engagement and conversion rates.
Layout shifts occur when elements move absent any user interaction. Investigate the causes of layout shifts, such as elements being added, removed, or their fonts changing as the page loads.
Performance issues directly impact user engagement and conversion rates.
Avoid chaining critical requests by reducing the length of chains, reducing the download size of resources, or deferring the download of unnecessary resources to improve page load.
Performance issues directly impact user engagement and conversion rates.
Requests are blocking the page's initial render, which may delay LCP. Deferring or inlining can move these network requests out of the critical path.
Performance issues directly impact user engagement and conversion rates.
A long cache lifetime can speed up repeat visits to your page. Learn more about caching.
Performance issues directly impact user engagement and conversion rates.
| Request | Cache TTL | Transfer Size |
|---|---|---|
| /binaries/content/gallery/featureditems/council-elections... | 300.0 s | 113.9 KiB |
| /binaries/content/gallery/featureditems/costofliving-supp... | 300.0 s | 12.6 KiB |
| /binaries/content/gallery/featureditems/bank-holidays-png... | 300.0 s | 5.1 KiB |
| www.gov.scot/assets/scripts/vendor/svgxuse.min.js | 86400.0 s | 3.4 KiB |
| /assets/scripts/vendor/plausible/script.file-downloads.ou... | 86400.0 s | 3.2 KiB |
| www.gov.scot/assets/images/logos/scotgovlogo.svg | 86400.0 s | 2.4 KiB |
Reducing the download time of images can improve the perceived load time of the page and LCP. Learn more about optimizing image size
Performance issues directly impact user engagement and conversion rates.
| URL | Resource Size | Est Savings | |
|---|---|---|---|
Pre-election period div.gov_hero-item__media > a > div.gov_hero-item__figure > img.gov_hero-item__image | /binaries/content/gallery/featureditems/council-elections... | 113.2 KiB | 105.6 KiB |
These insights are also available in the Chrome DevTools Performance Panel - record a trace to view more detailed information.
Reduce unused rules from stylesheets and defer CSS not used for above-the-fold content to decrease bytes consumed by network activity. Learn how to reduce unused CSS.
Performance issues directly impact user engagement and conversion rates.
| URL | Transfer Size | Est Savings |
|---|---|---|
| www.gov.scot/webfiles/1776248299365/assets/css/main.css | 34.3 KiB | 31.1 KiB |
Reduce unused JavaScript and defer loading scripts until they are required to decrease bytes consumed by network activity. Learn how to reduce unused JavaScript.
Multi-megabyte JavaScript bundles delay every interactive feature on the page.
This is the Lighthouse audit fired when too much JS is shipped relative to what executes. The fix isn't a config flag — it requires bundle analysis (webpack-bundle-analyzer, rollup-plugin-visualizer), splitting routes into chunks, lazy-loading off-screen components, and removing unused dependencies. Fundamentally different from minification: minifying reduces byte count, this reduces what's downloaded at all.
Source: Google web.dev / Lighthouse
| URL | Transfer Size | Est Savings |
|---|---|---|
| www.gov.scot/webfiles/1776248299365/assets/scripts/global.js | 32.3 KiB | 23.3 KiB |
More information about the performance of your application. These numbers don't directly affect the Performance score.
These are the largest layout shifts observed on the page. Each table item represents a single layout shift, and shows the element that shifted the most. Below each item are possible root causes that led to the layout shift. Some of these layout shifts may not be included in the CLS metric value due to windowing. Learn how to improve CLS
Performance issues directly impact user engagement and conversion rates.
| Element | Layout shift score |
|---|---|
The Scottish Government
Pre-election period
We are in the pre-election period … body > div.ds_page > div.ds_page__middle | 0.633 |
Accept all cookies div.ds_wrapper > div.ds_notification__content > div.ds_button-group > button.ds_button | 0.000 |
These checks highlight opportunities to improve the accessibility of your web app. Automatic detection can only detect a subset of issues and does not guarantee the accessibility of your web app, so manual testing is also encouraged.
Some ARIA roles have required attributes that describe the state of the element to screen readers. Learn more about roles and required attributes.
Performance issues directly impact user engagement and conversion rates.
| Failing Elements |
|---|
Information div#important-banner > div.ds_wrapper > div.ds_notification__content > div.visually-hidden |
These are opportunities to improve the usage of ARIA in your application which may enhance the experience for users of assistive technology, like a screen reader.
These checks ensure that your page is following basic search engine optimization advice. There are many additional factors Lighthouse does not score here that may affect your search ranking, including performance on Core Web Vitals. Learn more about Google Search Essentials.
Industry-standard audits powered by Google Lighthouse. — Desktop
Key metrics that affect user experience. — Desktop
First Contentful Paint First Contentful Paint — how long until the browser renders the first piece of content. Under 1.8s is good.
497 ms
Largest Contentful Paint Largest Contentful Paint — how long until the largest visible element loads. Under 2.5s is good.
805 ms
Total Blocking Time Total Blocking Time — total time the main thread was blocked, preventing user input. Under 200ms is good.
0 ms
Cumulative Layout Shift Cumulative Layout Shift — measures visual stability. How much the page layout shifts during loading. Under 0.1 is good.
0.233
Speed Index Speed Index — how quickly content is visually displayed during load. Under 3.4s is good.
497 ms
Time to Interactive Time to Interactive — how long until the page is fully interactive and responds to user input. Under 3.8s is good.
805 ms
Audit breakdown by category with detailed findings.
Remove large, duplicate JavaScript modules from bundles to reduce unnecessary bytes consumed by network activity.
Performance issues directly impact user engagement and conversion rates.
Polyfills and transforms enable older browsers to use new JavaScript features. However, many aren't necessary for modern browsers. Consider modifying your JavaScript build process to not transpile Baseline features, unless you know you must support older browsers. Learn why most sites can deploy ES6+ code without transpiling
Shipping ES5 transpiled code to modern browsers wastes bytes — every user with an evergreen browser pays for compatibility you don't need.
Most users today run browsers that natively support ES6+, async/await, optional chaining, and the rest of modern JavaScript. Transpiling to ES5 'just in case' adds 20-40% to your bundle for no benefit. Configure your build to target a modern browserslist, or ship a differential bundle pair (modern + legacy) with the module/nomodule pattern.
Source: Google web.dev / Lighthouse
3rd party code can significantly impact load performance. Reduce and defer loading of 3rd party code to prioritize your page's content.
Performance issues directly impact user engagement and conversion rates.
A long cache lifetime can speed up repeat visits to your page. Learn more about caching.
Performance issues directly impact user engagement and conversion rates.
| Request | Cache TTL | Transfer Size |
|---|---|---|
| /binaries/content/gallery/featureditems/council-elections... | 300.0 s | 33.1 KiB |
| /binaries/content/gallery/featureditems/costofliving-supp... | 300.0 s | 8.7 KiB |
| /binaries/content/gallery/navigationcardimages/swinney-po... | 300.0 s | 4.7 KiB |
| /binaries/content/gallery/featureditems/bank-holidays-png... | 300.0 s | 4.7 KiB |
| www.gov.scot/assets/scripts/vendor/svgxuse.min.js | 86400.0 s | 3.4 KiB |
| /assets/scripts/vendor/plausible/script.file-downloads.ou... | 86400.0 s | 3.2 KiB |
| www.gov.scot/assets/images/logos/scotgovlogo.svg | 86400.0 s | 2.3 KiB |
| www.gov.scot/assets/images/logos/ogl.svg | 86400.0 s | 1.5 KiB |
| www.gov.scot/assets/images/logos/scottish-government--min.svg | 86400.0 s | 1.5 KiB |
Layout shifts occur when elements move absent any user interaction. Investigate the causes of layout shifts, such as elements being added, removed, or their fonts changing as the page loads.
Performance issues directly impact user engagement and conversion rates.
Optimize LCP by making the LCP image discoverable from the HTML immediately, and avoiding lazy-loading
Performance issues directly impact user engagement and conversion rates.
Avoid chaining critical requests by reducing the length of chains, reducing the download size of resources, or deferring the download of unnecessary resources to improve page load.
Performance issues directly impact user engagement and conversion rates.
Requests are blocking the page's initial render, which may delay LCP. Deferring or inlining can move these network requests out of the critical path.
Performance issues directly impact user engagement and conversion rates.
| URL | Transfer Size | Duration |
|---|---|---|
| fonts.googleapis.com/css?family=Roboto:100,300,400,700,400italic&display=swap | 2.4 KiB | 283 ms |
| maxcdn.bootstrapcdn.com/font-awesome/4.4.0/css/font-awesome.min.css | 6.5 KiB | 263 ms |
| www.gov.scot/webfiles/1776248299365/assets/scripts/gtm.js | 2.1 KiB | 135 ms |
| www.gov.scot/webfiles/1776248299365/assets/scripts/js-enabled.js | 840 B | 135 ms |
| www.gov.scot/webfiles/1776248299365/assets/css/main.css | 34.9 KiB | 263 ms |
| www.gov.scot/webfiles/1776248299365/assets/scripts/datalayer.js | 1.1 KiB | 135 ms |
These insights are also available in the Chrome DevTools Performance Panel - record a trace to view more detailed information.
Reduce unused rules from stylesheets and defer CSS not used for above-the-fold content to decrease bytes consumed by network activity. Learn how to reduce unused CSS.
Performance issues directly impact user engagement and conversion rates.
| URL | Transfer Size | Est Savings |
|---|---|---|
| www.gov.scot/webfiles/1776248299365/assets/css/main.css | 34.3 KiB | 29.6 KiB |
Reduce unused JavaScript and defer loading scripts until they are required to decrease bytes consumed by network activity. Learn how to reduce unused JavaScript.
Multi-megabyte JavaScript bundles delay every interactive feature on the page.
This is the Lighthouse audit fired when too much JS is shipped relative to what executes. The fix isn't a config flag — it requires bundle analysis (webpack-bundle-analyzer, rollup-plugin-visualizer), splitting routes into chunks, lazy-loading off-screen components, and removing unused dependencies. Fundamentally different from minification: minifying reduces byte count, this reduces what's downloaded at all.
Source: Google web.dev / Lighthouse
| URL | Transfer Size | Est Savings |
|---|---|---|
| www.gov.scot/webfiles/1776248299365/assets/scripts/global.js | 32.3 KiB | 23.3 KiB |
More information about the performance of your application. These numbers don't directly affect the Performance score.
These are the largest layout shifts observed on the page. Each table item represents a single layout shift, and shows the element that shifted the most. Below each item are possible root causes that led to the layout shift. Some of these layout shifts may not be included in the CLS metric value due to windowing. Learn how to improve CLS
Performance issues directly impact user engagement and conversion rates.
| Element | Layout shift score |
|---|---|
The Scottish Government
Pre-election period
We are in the pre-election period … body > div.ds_page > div.ds_page__middle | 0.232 |
Search
Search div.ds_wrapper > div.ds_site-header__content > div.ds_site-header__search > div.ds_site-search | 0.001 |
These checks highlight opportunities to improve the accessibility of your web app. Automatic detection can only detect a subset of issues and does not guarantee the accessibility of your web app, so manual testing is also encouraged.
Some ARIA roles have required attributes that describe the state of the element to screen readers. Learn more about roles and required attributes.
Performance issues directly impact user engagement and conversion rates.
| Failing Elements |
|---|
Information div#important-banner > div.ds_wrapper > div.ds_notification__content > div.visually-hidden |
These are opportunities to improve the usage of ARIA in your application which may enhance the experience for users of assistive technology, like a screen reader.
These checks ensure that your page is following basic search engine optimization advice. There are many additional factors Lighthouse does not score here that may affect your search ranking, including performance on Core Web Vitals. Learn more about Google Search Essentials.
Send Feedback