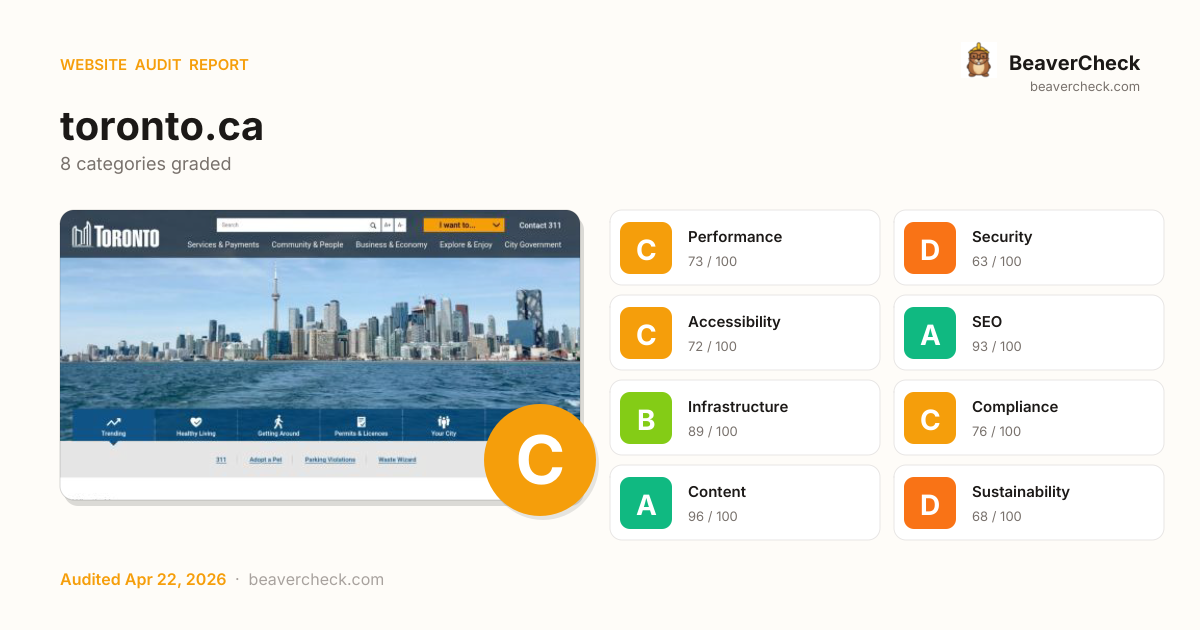
URL substituted: You submitted https://toronto.ca but we scanned https://www.toronto.ca instead — the submitted hostname refused our connection, so we retried on the www. variant
Mobile 375 × 812

Desktop 1440 × 900

Score: 75 / 100
Based on 8 categories, 0 sections
Decent speed, but optimizing further could improve engagement.
Several missing protections leave your users and data exposed.
Mostly accessible, but some users still face barriers.
Well-optimized for search — your content is discoverable.
Solid infrastructure — fast server responses across the board.
Mostly compliant — a few items need attention.
Rich content metadata — your pages look great everywhere.
Heavier than average — reducing page weight saves energy and bandwidth.
The overall score is a weighted average of individual category scores. Categories with more impact on user experience and security carry more weight.
Weights reflect general web best practices. Individual needs may differ.
Content-Security-Policy header is missing
Security gaps expose your site and users to attacks, eroding trust.
No Content-Security-Policy header found
Security gaps expose your site and users to attacks, eroding trust.
1 button(s) with no accessible text
Accessibility issues exclude users with disabilities — up to 15% of your potential audience.
6 control(s) without accessible label
Accessibility issues exclude users with disabilities — up to 15% of your potential audience.
No <main> landmark found
Accessibility issues exclude users with disabilities — up to 15% of your potential audience.
High impact, low effort — start here.
High impact, requires investment.
Small gains, minimal effort.
Nothing in this quadrant — good news.
Low impact, high effort — do last.
Nothing in this quadrant — good news.
[](https://beavercheck.com/results/6b824620-9dce-421e-b9b5-d6121b4b7c09)<a href="https://beavercheck.com/results/6b824620-9dce-421e-b9b5-d6121b4b7c09"><img src="https://beavercheck.com/badge?url=https%3A%2F%2Ftoronto.ca" alt="BeaverCheck Score"></a>https://beavercheck.com/badge?url=https%3A%2F%2Ftoronto.caThis badge auto-updates with your latest scan result.
Your site performs reasonably well, but a few targeted fixes could meaningfully improve results. Addressing the critical issues below would have the most immediate impact on your user trust.
6 barrier(s) likely increasing bounce by ~28%.
Page takes 15.6s to load
+12% bounceUsers abandon at ~3s — you're 13.1s over the 2.5s threshold
Fix: Optimize render-blocking resources, preload the hero image, and compress images
High main-thread blocking time
+2% bouncePage is non-interactive for 532ms after first paint
Fix: Defer third-party scripts and split large bundles
No Content-Security-Policy header
+1% bounceHigher XSS blast radius — one compromised script can exfiltrate the checkout form
Fix: Ship a reporting-only CSP first, then enforce once violations are clean
6 form field(s) without a label
+6% bounceScreen readers skip unlabeled fields; autofill can't identify them; checkout abandonment spikes
Fix: Associate every input with a visible <label for="…">; add autocomplete attributes
Content is hard to read
+2% bounceGraduate-level reading difficulty — limits the addressable audience for product or blog pages
Fix: Shorten sentences; replace jargon with plain language; target Flesch ease ≥60
1 broken link(s) on the page
+2% bounceClicks land on 404s — trust drops and the session often ends
Fix: Fix or remove the broken destinations surfaced on the Content tab
Preliminary CRO audit — each barrier links to the tab with detailed analysis.
CAD 523 investment → CAD 0.75/month returns + CAD 350,000 risk avoided
CAD 523
6h · 5 findings
CAD 0.75 /mo
~CAD 8.96 / year
CAD 350,000
if kept compliant
CAD 95 — in quick wins — start here for the fastest payback
Figures combine localized regulatory fine ceilings, search/conversion value priced against local CPC, and bandwidth waste estimates. Results depend on implementation quality and audience composition. Not legal or financial advice.
5.5 developer hours at CA$95/hr
Based on Canada rates (CA$95/hr)
Start here for the best return on investment
CAD 29,167 / month at risk
~CAD 350,009 / year if left unfixed
CAD 350,000
+4 more
CAD 0.75 /mo
6902.8 MB/mo × 0.108 CAD/GB
Compliance figures represent the statutory maximum fine for the most severe triggered category, capped per regulation — not the sum of per-finding penalties. Based on published regulatory fine ranges. This is not legal advice.
Unique monthly visitors from your analytics
Purchases, signups, or key actions
Optional — for revenue estimation
more engaged visitors from reduced bounce
Fix 5 critical issues to capture this value
Based on Google/Deloitte research ("Milliseconds Make Millions") showing a ~7% bounce rate increase per additional second of LCP above the 2.5s "Good" threshold.
Your site's LCP: → estimated after fixes.
These are estimates based on industry research — actual results vary
Your data stays in your browser — nothing is sent to our servers
Thanks for your feedback!
We'll use a cached audit if available, or offer to scan.
Industry-standard audits powered by Google Lighthouse.
Key metrics that affect user experience.
First Contentful Paint First Contentful Paint — how long until the browser renders the first piece of content. Under 1.8s is good.
7.91 s
Largest Contentful Paint Largest Contentful Paint — how long until the largest visible element loads. Under 2.5s is good.
15.61 s
Total Blocking Time Total Blocking Time — total time the main thread was blocked, preventing user input. Under 200ms is good.
532 ms
Cumulative Layout Shift Cumulative Layout Shift — measures visual stability. How much the page layout shifts during loading. Under 0.1 is good.
0.000
Speed Index Speed Index — how quickly content is visually displayed during load. Under 3.4s is good.
7.91 s
Time to Interactive Time to Interactive — how long until the page is fully interactive and responds to user input. Under 3.8s is good.
16.12 s
Audit breakdown by category with detailed findings.
Remove large, duplicate JavaScript modules from bundles to reduce unnecessary bytes consumed by network activity.
Performance issues directly impact user engagement and conversion rates.
Polyfills and transforms enable older browsers to use new JavaScript features. However, many aren't necessary for modern browsers. Consider modifying your JavaScript build process to not transpile Baseline features, unless you know you must support older browsers. Learn why most sites can deploy ES6+ code without transpiling
Shipping ES5 transpiled code to modern browsers wastes bytes — every user with an evergreen browser pays for compatibility you don't need.
Most users today run browsers that natively support ES6+, async/await, optional chaining, and the rest of modern JavaScript. Transpiling to ES5 'just in case' adds 20-40% to your bundle for no benefit. Configure your build to target a modern browserslist, or ship a differential bundle pair (modern + legacy) with the module/nomodule pattern.
Source: Google web.dev / Lighthouse
3rd party code can significantly impact load performance. Reduce and defer loading of 3rd party code to prioritize your page's content.
Performance issues directly impact user engagement and conversion rates.
A long cache lifetime can speed up repeat visits to your page. Learn more about caching.
Performance issues directly impact user engagement and conversion rates.
A forced reflow occurs when JavaScript queries geometric properties (such as offsetWidth) after styles have been invalidated by a change to the DOM state. This can result in poor performance. Learn more about forced reflows and possible mitigations.
Performance issues directly impact user engagement and conversion rates.
Reducing the download time of images can improve the perceived load time of the page and LCP. Learn more about optimizing image size
Performance issues directly impact user engagement and conversion rates.
| URL | Resource Size | Est Savings | |
|---|---|---|---|
Three people holding golf clubs and standing on a grassy golf range in the addr… div.row > div.col-sm-3 > a.thumbnail > img | /wp-content/uploads/2024/04/94a1-Homepage-Golf-Opener-Ite... | 203.2 KiB | 189.1 KiB |
Toronto skyline from a ferry view across Lake Ontario, showing the downtown wat… section#home-carousel > div.carousel-inner > div.item > img | www.toronto.ca/wp-content/uploads/2026/04/94e4-homeskyline-1500x700.jpg | 156.8 KiB | 145.0 KiB |
A carbon monoxide alarm on the wall. div.row > div.col-sm-3 > a.thumbnail > img | /wp-content/uploads/2026/01/94b7-carbon-monoxide-alarm-ho... | 117.9 KiB | 103.8 KiB |
Homes on a street in autumn with bare trees and fallen leaves. div.row > div.col-sm-3 > a.thumbnail > img | /wp-content/uploads/2024/11/962d-Homes-in-Fall-Home-Page-... | 77.6 KiB | 63.5 KiB |
A resident handing a stereo to a City staff member for reuse or recycling at a … div.row > div.col-sm-3 > a.thumbnail > img | www.toronto.ca/wp-content/uploads/2025/04/96c2-CED-homepage-2025-C.jpg | 23.9 KiB | 9.8 KiB |
Optimize LCP by making the LCP image discoverable from the HTML immediately, and avoiding lazy-loading
Performance issues directly impact user engagement and conversion rates.
Avoid chaining critical requests by reducing the length of chains, reducing the download size of resources, or deferring the download of unnecessary resources to improve page load.
Performance issues directly impact user engagement and conversion rates.
Requests are blocking the page's initial render, which may delay LCP. Deferring or inlining can move these network requests out of the critical path.
Performance issues directly impact user engagement and conversion rates.
| URL | Transfer Size | Duration |
|---|---|---|
| www.toronto.ca/resources/event_cal_widget/styles/main1.0.8.css | 2.2 KiB | 166 ms |
| www.toronto.ca/resources/311_widgets/styles/311_widgets.css?ver=6.8.3 | 1.4 KiB | 482 ms |
| www.toronto.ca/resources/wp-feedback/styles/main0.1.0.css | 2.2 KiB | 166 ms |
| /wp-content/themes/cot/assets/js-cookie/dist/js.cookie.mi... | 1.2 KiB | 166 ms |
| www.toronto.ca/resources/cdn/cotui/2.4.3/cotui.css?ver=6.8.3 | 1.4 KiB | 166 ms |
| /wp-content/plugins/cot-custom/mediaplayer/dist/ableplaye... | 4.4 KiB | 640 ms |
| www.toronto.ca/cot/style.css | 2.4 KiB | 166 ms |
| /wp-content/themes/cot/assets/fontawesome/css/all.min.css... | 22.0 KiB | 1.3 s |
| www.toronto.ca/wp-content/themes/cot/css/cot.css?ver=1776362564 | 16.9 KiB | 640 ms |
| www.toronto.ca/wp-content/themes/cot/css/bootstrap.3.4.1.min.css?ver=1776362564 | 18.2 KiB | 1.1 s |
| www.toronto.ca/wp-includes/css/dist/block-library/style.min.css?ver=6.8.3 | 14.5 KiB | 955 ms |
Your first network request is the most important. Reduce its latency by avoiding redirects, ensuring a fast server response, and enabling text compression.
Performance issues directly impact user engagement and conversion rates.
Consider setting font-display to swap or optional to ensure text is consistently visible. swap can be further optimized to mitigate layout shifts with font metric overrides.
Performance issues directly impact user engagement and conversion rates.
These insights are also available in the Chrome DevTools Performance Panel - record a trace to view more detailed information.
Time to Interactive is the amount of time it takes for the page to become fully interactive. Learn more about the Time to Interactive metric.
Performance issues directly impact user engagement and conversion rates.
The maximum potential First Input Delay that your users could experience is the duration of the longest task. Learn more about the Maximum Potential First Input Delay metric.
Performance issues directly impact user engagement and conversion rates.
Reduce unused rules from stylesheets and defer CSS not used for above-the-fold content to decrease bytes consumed by network activity. Learn how to reduce unused CSS.
Performance issues directly impact user engagement and conversion rates.
| URL | Transfer Size | Est Savings |
|---|---|---|
| /wp-content/themes/cot/assets/fontawesome/css/all.min.css... | 21.6 KiB | 21.5 KiB |
| www.toronto.ca/wp-content/themes/cot/css/bootstrap.3.4.1.min.css?ver=1776362564 | 17.8 KiB | 16.6 KiB |
| www.toronto.ca/wp-content/themes/cot/css/cot.css?ver=1776362564 | 16.4 KiB | 14.4 KiB |
| www.toronto.ca/wp-includes/css/dist/block-library/style.min.css?ver=6.8.3 | 14.0 KiB | 14.0 KiB |
Reduce unused JavaScript and defer loading scripts until they are required to decrease bytes consumed by network activity. Learn how to reduce unused JavaScript.
Multi-megabyte JavaScript bundles delay every interactive feature on the page.
This is the Lighthouse audit fired when too much JS is shipped relative to what executes. The fix isn't a config flag — it requires bundle analysis (webpack-bundle-analyzer, rollup-plugin-visualizer), splitting routes into chunks, lazy-loading off-screen components, and removing unused dependencies. Fundamentally different from minification: minifying reduces byte count, this reduces what's downloaded at all.
Source: Google web.dev / Lighthouse
| URL | Transfer Size | Est Savings |
|---|---|---|
| www.gstatic.com/recaptcha/releases/gTpTIWhbKpxADzTzkcabhXN4/recaptcha__en.js | 361.8 KiB | 177.1 KiB |
| /_/translate_http/_/js/k=translate_http.tr.nl.2-2JqXXxIUQ... | 118.2 KiB | 93.6 KiB |
| maps.googleapis.com/maps/api/js?client=gme-cityoftoronto&v=3 | 99.9 KiB | 62.9 KiB |
| maps.googleapis.com/maps-api-v3/api/js/63/14d/util.js | 102.7 KiB | 38.3 KiB |
| maps.googleapis.com/maps-api-v3/api/js/63/14d/common.js | 41.2 KiB | 30.5 KiB |
| www.toronto.ca/wp-content/themes/cot/js/footer.js?ver=6.8.3 | 53.4 KiB | 29.5 KiB |
| www.toronto.ca/resources/event_cal_widget/scripts/main1.0.8.js | 64.8 KiB | 23.1 KiB |
Consider reducing the time spent parsing, compiling, and executing JS. You may find delivering smaller JS payloads helps with this. Learn how to reduce Javascript execution time.
Performance issues directly impact user engagement and conversion rates.
| URL | Total CPU Time | Script Evaluation | Script Parse |
|---|---|---|---|
| www.gstatic.com/recaptcha/releases/gTpTIWhbKpxADzTzkcabhXN4/recaptcha__en.js | 1.4 s | 1.2 s | 142 ms |
| www.toronto.ca/ | 1.2 s | 9.3 ms | 5.5 ms |
| Unattributable | 824 ms | 17 ms | 0.0 ms |
| www.toronto.ca/wp-content/themes/cot/js/jquery-3.6.0.min.js | 810 ms | 587 ms | 17 ms |
| www.toronto.ca/wp-content/themes/cot/js/footer.js?ver=6.8.3 | 404 ms | 212 ms | 30 ms |
| /_/translate_http/_/js/k=translate_http.tr.nl.2-2JqXXxIUQ... | 338 ms | 259 ms | 64 ms |
| maps.googleapis.com/maps/api/js?client=gme-cityoftoronto&v=3 | 255 ms | 171 ms | 60 ms |
| www.toronto.ca/resources/event_cal_widget/scripts/main1.0.8.js | 164 ms | 117 ms | 47 ms |
| www.toronto.ca/resources/wp-feedback/scripts/main0.1.0.js | 157 ms | 134 ms | 21 ms |
| /acs/account/97j62divdr/js/main/odc.js?_ora.context=analy... | 125 ms | 103 ms | 7.2 ms |
| /infy/acs/account/97j62divdr/js/main/analytics-production... | 109 ms | 97 ms | 7.2 ms |
| translate.google.com/translate_a/element.js?cb=translate&ver=6.8.3 | 52 ms | 38 ms | 13 ms |
| www.toronto.ca/wp-content/themes/cot/js/scripts.js?ver=6.8.3 | 51 ms | 15 ms | 7.0 ms |
Consider reducing the time spent parsing, compiling and executing JS. You may find delivering smaller JS payloads helps with this. Learn how to minimize main-thread work
Performance issues directly impact user engagement and conversion rates.
| Category | Time Spent |
|---|---|
| Script Evaluation | 3.2 s |
| Other | 1.6 s |
| Style & Layout | 587 ms |
| Script Parsing & Compilation | 470 ms |
| Parse HTML & CSS | 250 ms |
| Rendering | 249 ms |
| Garbage Collection | 27 ms |
Minifying JavaScript files can reduce payload sizes and script parse time. Learn how to minify JavaScript.
Performance issues directly impact user engagement and conversion rates.
| URL | Transfer Size | Est Savings |
|---|---|---|
| www.toronto.ca/wp-content/themes/cot/js/footer.js?ver=6.8.3 | 53.4 KiB | 8.6 KiB |
| www.toronto.ca/wp-content/themes/cot/js/scripts.js?ver=6.8.3 | 10.1 KiB | 5.1 KiB |
| www.toronto.ca/cot/script.js?ver=1.0.0 | 8.9 KiB | 3.5 KiB |
Set an explicit width and height on image elements to reduce layout shifts and improve CLS. Learn how to set image dimensions
Performance issues directly impact user engagement and conversion rates.
| URL | |
|---|---|
A resident handing a stereo to a City staff member for reuse or recycling at a … div.row > div.col-sm-3 > a.thumbnail > img | www.toronto.ca/wp-content/uploads/2025/04/96c2-CED-homepage-2025-C.jpg |
Homes on a street in autumn with bare trees and fallen leaves. div.row > div.col-sm-3 > a.thumbnail > img | /wp-content/uploads/2024/11/962d-Homes-in-Fall-Home-Page-... |
Three people holding golf clubs and standing on a grassy golf range in the addr… div.row > div.col-sm-3 > a.thumbnail > img | /wp-content/uploads/2024/04/94a1-Homepage-Golf-Opener-Ite... |
A carbon monoxide alarm on the wall. div.row > div.col-sm-3 > a.thumbnail > img | /wp-content/uploads/2026/01/94b7-carbon-monoxide-alarm-ho... |
Twitter nav#social-nav > div#f-icons-1 > a > img | www.toronto.ca/wp-content/themes/cot/img/icon-twitter.svg |
Facebook nav#social-nav > div#f-icons-1 > a > img | www.toronto.ca/wp-content/themes/cot/img/icon-facebook.svg |
Instagram nav#social-nav > div#f-icons-1 > a > img | www.toronto.ca/wp-content/themes/cot/img/icon-instagram.svg |
Youtube nav#social-nav > div#f-icons-2 > a > img | www.toronto.ca/wp-content/themes/cot/img/icon-youtube.svg |
LinkedIn nav#social-nav > div#f-icons-2 > a > img | www.toronto.ca/wp-content/themes/cot/img/icon-linkedin.svg |
nav#social-nav > div#f-icons-2 > a > img nav#social-nav > div#f-icons-2 > a > img | www.toronto.ca/wp-content/themes/cot/img/icon-blank.svg |
Search form#siteSearch > div > button#query-search > img | www.toronto.ca/wp-content/themes/cot/img/icon-search.svg |
More information about the performance of your application. These numbers don't directly affect the Performance score.
These checks highlight opportunities to improve the accessibility of your web app. Automatic detection can only detect a subset of issues and does not guarantee the accessibility of your web app, so manual testing is also encouraged.
Touch targets with sufficient size and spacing help users who may have difficulty targeting small controls to activate the targets. Learn more about touch targets.
Performance issues directly impact user engagement and conversion rates.
| Failing Elements |
|---|
© City of Toronto 1998 - 2026 div > div.container-fluid > p > a |
Privacy div > div.container-fluid > p > a |
Accessibility at the City of Toronto div > div.container-fluid > p > a |
One main landmark helps screen reader users navigate a web page. Learn more about landmarks.
Performance issues directly impact user engagement and conversion rates.
| Failing Elements |
|---|
html.hydrated html.hydrated |
These items highlight common accessibility best practices.
Image natural dimensions should be proportional to the display size and the pixel ratio to maximize image clarity. Learn how to provide responsive images.
Performance issues directly impact user engagement and conversion rates.
| URL | Displayed size | Actual size | Expected size | |
|---|---|---|---|---|
A resident handing a stereo to a City staff member for reuse or recycling at a … div.row > div.col-sm-3 > a.thumbnail > img | www.toronto.ca/wp-content/uploads/2025/04/96c2-CED-homepage-2025-C.jpg | 348 x 249 | 350 x 250 | 522 x 374 |
These checks ensure that your page is following basic search engine optimization advice. There are many additional factors Lighthouse does not score here that may affect your search ranking, including performance on Core Web Vitals. Learn more about Google Search Essentials.
If your robots.txt file is malformed, crawlers may not be able to understand how you want your website to be crawled or indexed. Learn more about robots.txt.
Performance issues directly impact user engagement and conversion rates.
| Line # | Content | Error |
|---|---|---|
| 3 | Disallow: readme.html | Pattern should either be empty, start with "/" or "*" |
| 4 | Disallow: license.txt | Pattern should either be empty, start with "/" or "*" |
To appear in search results, crawlers need access to your app.
Industry-standard audits powered by Google Lighthouse. — Desktop
Key metrics that affect user experience. — Desktop
First Contentful Paint First Contentful Paint — how long until the browser renders the first piece of content. Under 1.8s is good.
623 ms
Largest Contentful Paint Largest Contentful Paint — how long until the largest visible element loads. Under 2.5s is good.
1.42 s
Total Blocking Time Total Blocking Time — total time the main thread was blocked, preventing user input. Under 200ms is good.
50 ms
Cumulative Layout Shift Cumulative Layout Shift — measures visual stability. How much the page layout shifts during loading. Under 0.1 is good.
0.047
Speed Index Speed Index — how quickly content is visually displayed during load. Under 3.4s is good.
1.10 s
Time to Interactive Time to Interactive — how long until the page is fully interactive and responds to user input. Under 3.8s is good.
3.22 s
Audit breakdown by category with detailed findings.
Remove large, duplicate JavaScript modules from bundles to reduce unnecessary bytes consumed by network activity.
Performance issues directly impact user engagement and conversion rates.
Polyfills and transforms enable older browsers to use new JavaScript features. However, many aren't necessary for modern browsers. Consider modifying your JavaScript build process to not transpile Baseline features, unless you know you must support older browsers. Learn why most sites can deploy ES6+ code without transpiling
Shipping ES5 transpiled code to modern browsers wastes bytes — every user with an evergreen browser pays for compatibility you don't need.
Most users today run browsers that natively support ES6+, async/await, optional chaining, and the rest of modern JavaScript. Transpiling to ES5 'just in case' adds 20-40% to your bundle for no benefit. Configure your build to target a modern browserslist, or ship a differential bundle pair (modern + legacy) with the module/nomodule pattern.
Source: Google web.dev / Lighthouse
3rd party code can significantly impact load performance. Reduce and defer loading of 3rd party code to prioritize your page's content.
Performance issues directly impact user engagement and conversion rates.
A long cache lifetime can speed up repeat visits to your page. Learn more about caching.
Performance issues directly impact user engagement and conversion rates.
Consider setting font-display to swap or optional to ensure text is consistently visible. swap can be further optimized to mitigate layout shifts with font metric overrides.
Performance issues directly impact user engagement and conversion rates.
Reducing the download time of images can improve the perceived load time of the page and LCP. Learn more about optimizing image size
Performance issues directly impact user engagement and conversion rates.
| URL | Resource Size | Est Savings | |
|---|---|---|---|
Three people holding golf clubs and standing on a grassy golf range in the addr… div.row > div.col-sm-3 > a.thumbnail > img | /wp-content/uploads/2024/04/94a1-Homepage-Golf-Opener-Ite... | 203.2 KiB | 192.9 KiB |
A carbon monoxide alarm on the wall. div.row > div.col-sm-3 > a.thumbnail > img | /wp-content/uploads/2026/01/94b7-carbon-monoxide-alarm-ho... | 117.9 KiB | 107.6 KiB |
Homes on a street in autumn with bare trees and fallen leaves. div.row > div.col-sm-3 > a.thumbnail > img | /wp-content/uploads/2024/11/962d-Homes-in-Fall-Home-Page-... | 77.6 KiB | 67.3 KiB |
Toronto skyline from a ferry view across Lake Ontario, showing the downtown wat… section#home-carousel > div.carousel-inner > div.item > img | www.toronto.ca/wp-content/uploads/2026/04/94e4-homeskyline-1500x700.jpg | 156.8 KiB | 29.8 KiB |
A resident handing a stereo to a City staff member for reuse or recycling at a … div.row > div.col-sm-3 > a.thumbnail > img | www.toronto.ca/wp-content/uploads/2025/04/96c2-CED-homepage-2025-C.jpg | 23.9 KiB | 13.6 KiB |
Optimize LCP by making the LCP image discoverable from the HTML immediately, and avoiding lazy-loading
Performance issues directly impact user engagement and conversion rates.
Avoid chaining critical requests by reducing the length of chains, reducing the download size of resources, or deferring the download of unnecessary resources to improve page load.
Performance issues directly impact user engagement and conversion rates.
Requests are blocking the page's initial render, which may delay LCP. Deferring or inlining can move these network requests out of the critical path.
Performance issues directly impact user engagement and conversion rates.
Your first network request is the most important. Reduce its latency by avoiding redirects, ensuring a fast server response, and enabling text compression.
Performance issues directly impact user engagement and conversion rates.
These insights are also available in the Chrome DevTools Performance Panel - record a trace to view more detailed information.
Time to Interactive is the amount of time it takes for the page to become fully interactive. Learn more about the Time to Interactive metric.
Performance issues directly impact user engagement and conversion rates.
Reduce unused rules from stylesheets and defer CSS not used for above-the-fold content to decrease bytes consumed by network activity. Learn how to reduce unused CSS.
Performance issues directly impact user engagement and conversion rates.
| URL | Transfer Size | Est Savings |
|---|---|---|
| /wp-content/themes/cot/assets/fontawesome/css/all.min.css... | 21.6 KiB | 21.5 KiB |
| www.toronto.ca/wp-content/themes/cot/css/bootstrap.3.4.1.min.css?ver=1776362564 | 17.8 KiB | 16.5 KiB |
| www.toronto.ca/wp-includes/css/dist/block-library/style.min.css?ver=6.8.3 | 14.0 KiB | 14.0 KiB |
| www.toronto.ca/wp-content/themes/cot/css/cot.css?ver=1776362564 | 16.4 KiB | 13.5 KiB |
Reduce unused JavaScript and defer loading scripts until they are required to decrease bytes consumed by network activity. Learn how to reduce unused JavaScript.
Multi-megabyte JavaScript bundles delay every interactive feature on the page.
This is the Lighthouse audit fired when too much JS is shipped relative to what executes. The fix isn't a config flag — it requires bundle analysis (webpack-bundle-analyzer, rollup-plugin-visualizer), splitting routes into chunks, lazy-loading off-screen components, and removing unused dependencies. Fundamentally different from minification: minifying reduces byte count, this reduces what's downloaded at all.
Source: Google web.dev / Lighthouse
| URL | Transfer Size | Est Savings |
|---|---|---|
| www.gstatic.com/recaptcha/releases/gTpTIWhbKpxADzTzkcabhXN4/recaptcha__en.js | 361.8 KiB | 177.1 KiB |
| /_/translate_http/_/js/k=translate_http.tr.nl.2-2JqXXxIUQ... | 118.2 KiB | 93.6 KiB |
| maps.googleapis.com/maps/api/js?client=gme-cityoftoronto&v=3 | 99.9 KiB | 64.4 KiB |
| www.toronto.ca/wp-content/themes/cot/js/footer.js?ver=6.8.3 | 53.4 KiB | 30.2 KiB |
| www.toronto.ca/resources/event_cal_widget/scripts/main1.0.8.js | 64.8 KiB | 23.1 KiB |
Minifying JavaScript files can reduce payload sizes and script parse time. Learn how to minify JavaScript.
Performance issues directly impact user engagement and conversion rates.
| URL | Transfer Size | Est Savings |
|---|---|---|
| www.toronto.ca/wp-content/themes/cot/js/footer.js?ver=6.8.3 | 53.4 KiB | 8.6 KiB |
| www.toronto.ca/wp-content/themes/cot/js/scripts.js?ver=6.8.3 | 10.1 KiB | 5.1 KiB |
| www.toronto.ca/cot/script.js?ver=1.0.0 | 8.9 KiB | 3.5 KiB |
Set an explicit width and height on image elements to reduce layout shifts and improve CLS. Learn how to set image dimensions
Performance issues directly impact user engagement and conversion rates.
| URL | |
|---|---|
A resident handing a stereo to a City staff member for reuse or recycling at a … div.row > div.col-sm-3 > a.thumbnail > img | www.toronto.ca/wp-content/uploads/2025/04/96c2-CED-homepage-2025-C.jpg |
Homes on a street in autumn with bare trees and fallen leaves. div.row > div.col-sm-3 > a.thumbnail > img | /wp-content/uploads/2024/11/962d-Homes-in-Fall-Home-Page-... |
Three people holding golf clubs and standing on a grassy golf range in the addr… div.row > div.col-sm-3 > a.thumbnail > img | /wp-content/uploads/2024/04/94a1-Homepage-Golf-Opener-Ite... |
A carbon monoxide alarm on the wall. div.row > div.col-sm-3 > a.thumbnail > img | /wp-content/uploads/2026/01/94b7-carbon-monoxide-alarm-ho... |
Twitter nav#social-nav > div#f-icons-1 > a > img | www.toronto.ca/wp-content/themes/cot/img/icon-twitter.svg |
Facebook nav#social-nav > div#f-icons-1 > a > img | www.toronto.ca/wp-content/themes/cot/img/icon-facebook.svg |
Instagram nav#social-nav > div#f-icons-1 > a > img | www.toronto.ca/wp-content/themes/cot/img/icon-instagram.svg |
Youtube nav#social-nav > div#f-icons-2 > a > img | www.toronto.ca/wp-content/themes/cot/img/icon-youtube.svg |
LinkedIn nav#social-nav > div#f-icons-2 > a > img | www.toronto.ca/wp-content/themes/cot/img/icon-linkedin.svg |
nav#social-nav > div#f-icons-2 > a > img nav#social-nav > div#f-icons-2 > a > img | www.toronto.ca/wp-content/themes/cot/img/icon-blank.svg |
Search form#siteSearch > div > button#query-search > img | www.toronto.ca/wp-content/themes/cot/img/icon-search.svg |
More information about the performance of your application. These numbers don't directly affect the Performance score.
These checks highlight opportunities to improve the accessibility of your web app. Automatic detection can only detect a subset of issues and does not guarantee the accessibility of your web app, so manual testing is also encouraged.
One main landmark helps screen reader users navigate a web page. Learn more about landmarks.
Performance issues directly impact user engagement and conversion rates.
| Failing Elements |
|---|
html.hydrated html.hydrated |
These items highlight common accessibility best practices.
These checks ensure that your page is following basic search engine optimization advice. There are many additional factors Lighthouse does not score here that may affect your search ranking, including performance on Core Web Vitals. Learn more about Google Search Essentials.
If your robots.txt file is malformed, crawlers may not be able to understand how you want your website to be crawled or indexed. Learn more about robots.txt.
Performance issues directly impact user engagement and conversion rates.
| Line # | Content | Error |
|---|---|---|
| 3 | Disallow: readme.html | Pattern should either be empty, start with "/" or "*" |
| 4 | Disallow: license.txt | Pattern should either be empty, start with "/" or "*" |
To appear in search results, crawlers need access to your app.
Send Feedback