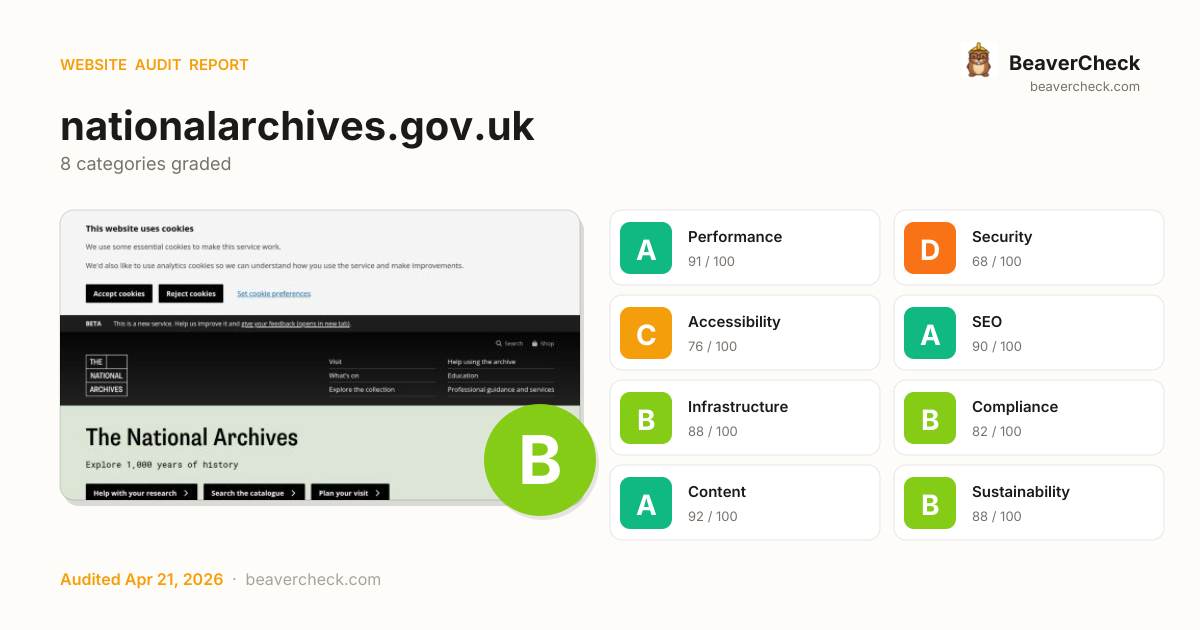
Mobile 375 × 812

Desktop 1440 × 900

Score: 82 / 100
Based on 8 categories, 0 sections
Fast site — your users get a smooth experience.
Several missing protections leave your users and data exposed.
Mostly accessible, but some users still face barriers.
Well-optimized for search — your content is discoverable.
Solid infrastructure — fast server responses across the board.
Mostly compliant — a few items need attention.
Rich content metadata — your pages look great everywhere.
Lean and efficient — low environmental impact per visit.
The overall score is a weighted average of individual category scores. Categories with more impact on user experience and security carry more weight.
Weights reflect general web best practices. Individual needs may differ.
Content-Security-Policy header is missing
Security gaps expose your site and users to attacks, eroding trust.
HSTS header is missing
Security gaps expose your site and users to attacks, eroding trust.
No Content-Security-Policy header found
Security gaps expose your site and users to attacks, eroding trust.
1 link(s) with no accessible text
Accessibility issues exclude users with disabilities — up to 15% of your potential audience.
19 third-party resources (100% of weight)
Performance issues directly impact user engagement and conversion rates.
High impact, low effort — start here.
High impact, requires investment.
Small gains, minimal effort.
Nothing in this quadrant — good news.
Low impact, high effort — do last.
Nothing in this quadrant — good news.
[](https://beavercheck.com/results/82a43d9a-9a61-463e-96b0-b692aed03d52)<a href="https://beavercheck.com/results/82a43d9a-9a61-463e-96b0-b692aed03d52"><img src="https://beavercheck.com/badge?url=https%3A%2F%2Fnationalarchives.gov.uk" alt="BeaverCheck Score"></a>https://beavercheck.com/badge?url=https%3A%2F%2Fnationalarchives.gov.ukThis badge auto-updates with your latest scan result.
Your site performs reasonably well, but a few targeted fixes could meaningfully improve results. Your LCP of 4.5s exceeds Google's 2.5s 'Good' threshold and the 1 performance issue below directly contributes to it. Addressing the critical issues below would have the most immediate impact on your user trust.
4 barrier(s) likely increasing bounce by ~23%.
Page takes 4.5s to load
+12% bounceUsers abandon at ~3s — you're 2.0s over the 2.5s threshold
Fix: Optimize render-blocking resources, preload the hero image, and compress images
No HSTS header
+1% bounceReturning visitors are briefly exposed to downgrade attacks on first request
Fix: Set Strict-Transport-Security: max-age=31536000; includeSubDomains
No Content-Security-Policy header
+1% bounceHigher XSS blast radius — one compromised script can exfiltrate the checkout form
Fix: Ship a reporting-only CSP first, then enforce once violations are clean
3 broken link(s) on the page
+5% bounceClicks land on 404s — trust drops and the session often ends
Fix: Fix or remove the broken destinations surfaced on the Content tab
Preliminary CRO audit — each barrier links to the tab with detailed analysis.
£375 investment → £2,627/month returns + GBP 18,000,000 risk avoided
£375
5h · 5 findings
£2,627 /mo
~£31,528 / year
GBP 18,000,000
if kept compliant
£113 — in quick wins — start here for the fastest payback
Figures combine localized regulatory fine ceilings, search/conversion value priced against local CPC, and bandwidth waste estimates. Results depend on implementation quality and audience composition. Not legal or financial advice.
5.0 developer hours at £75/hr
Based on United Kingdom rates (£75/hr)
Start here for the best return on investment
£1,500,000 / month at risk
~£18,000,001 / year if left unfixed
£18,000,000
+1 more
£0.08 /mo
1284.9 MB/mo × 0.063 GBP/GB
Compliance figures represent the statutory maximum fine for the most severe triggered category, capped per regulation — not the sum of per-finding penalties. Based on published regulatory fine ranges. This is not legal advice.
Unique monthly visitors from your analytics
Purchases, signups, or key actions
Optional — for revenue estimation
more engaged visitors from reduced bounce
Fix 4 critical issues to capture this value
Based on Google/Deloitte research ("Milliseconds Make Millions") showing a ~7% bounce rate increase per additional second of LCP above the 2.5s "Good" threshold.
Your site's LCP: → estimated after fixes.
These are estimates based on industry research — actual results vary
Your data stays in your browser — nothing is sent to our servers
Thanks for your feedback!
We'll use a cached audit if available, or offer to scan.
Industry-standard audits powered by Google Lighthouse.
Key metrics that affect user experience.
First Contentful Paint First Contentful Paint — how long until the browser renders the first piece of content. Under 1.8s is good.
4.24 s
Largest Contentful Paint Largest Contentful Paint — how long until the largest visible element loads. Under 2.5s is good.
4.47 s
Total Blocking Time Total Blocking Time — total time the main thread was blocked, preventing user input. Under 200ms is good.
0 ms
Cumulative Layout Shift Cumulative Layout Shift — measures visual stability. How much the page layout shifts during loading. Under 0.1 is good.
0.001
Speed Index Speed Index — how quickly content is visually displayed during load. Under 3.4s is good.
4.24 s
Time to Interactive Time to Interactive — how long until the page is fully interactive and responds to user input. Under 3.8s is good.
4.49 s
Audit breakdown by category with detailed findings.
Remove large, duplicate JavaScript modules from bundles to reduce unnecessary bytes consumed by network activity.
Performance issues directly impact user engagement and conversion rates.
Polyfills and transforms enable older browsers to use new JavaScript features. However, many aren't necessary for modern browsers. Consider modifying your JavaScript build process to not transpile Baseline features, unless you know you must support older browsers. Learn why most sites can deploy ES6+ code without transpiling
Shipping ES5 transpiled code to modern browsers wastes bytes — every user with an evergreen browser pays for compatibility you don't need.
Most users today run browsers that natively support ES6+, async/await, optional chaining, and the rest of modern JavaScript. Transpiling to ES5 'just in case' adds 20-40% to your bundle for no benefit. Configure your build to target a modern browserslist, or ship a differential bundle pair (modern + legacy) with the module/nomodule pattern.
Source: Google web.dev / Lighthouse
3rd party code can significantly impact load performance. Reduce and defer loading of 3rd party code to prioritize your page's content.
Performance issues directly impact user engagement and conversion rates.
Your first network request is the most important. Reduce its latency by avoiding redirects, ensuring a fast server response, and enabling text compression.
Performance issues directly impact user engagement and conversion rates.
HTTP/2 and HTTP/3 offer many benefits over HTTP/1.1, such as multiplexing. Learn more about using modern HTTP.
Performance issues directly impact user engagement and conversion rates.
Avoid chaining critical requests by reducing the length of chains, reducing the download size of resources, or deferring the download of unnecessary resources to improve page load.
Performance issues directly impact user engagement and conversion rates.
Requests are blocking the page's initial render, which may delay LCP. Deferring or inlining can move these network requests out of the critical path.
Performance issues directly impact user engagement and conversion rates.
| URL | Transfer Size | Duration |
|---|---|---|
| /css2?family=Open+Sans:wght@400..700&family=Roboto+Mono:w... | 2.1 KiB | 783 ms |
| use.typekit.net/kaq6qqh.css | 853 B | 761 ms |
| www.nationalarchives.gov.uk/static/font-awesome.css?v=26.04.16.1630 | 22.0 KiB | 1.1 s |
| www.nationalarchives.gov.uk/static/homepage.css?v=26.04.16.1630 | 2.2 KiB | 459 ms |
| www.nationalarchives.gov.uk/static/main.css?v=26.04.16.1630 | 20.0 KiB | 760 ms |
| p.typekit.net/p.css?s=1&k=kaq6qqh&ht=tk&f=17141&a=157040217&app=typekit&e=css | 173 B | 755 ms |
A long cache lifetime can speed up repeat visits to your page. Learn more about caching.
Performance issues directly impact user engagement and conversion rates.
| Request | Cache TTL | Transfer Size |
|---|---|---|
| p.typekit.net/p.css?s=1&k=kaq6qqh&ht=tk&f=17141&a=157040217&app=typekit&e=css | 604800.0 s | 173 B |
Consider setting font-display to swap or optional to ensure text is consistently visible. swap can be further optimized to mitigate layout shifts with font metric overrides.
Performance issues directly impact user engagement and conversion rates.
| URL | Est Savings |
|---|---|
| www.nationalarchives.gov.uk/static/assets/fonts/fa-solid-900.woff2 | 15 ms |
Reducing the download time of images can improve the perceived load time of the page and LCP. Learn more about optimizing image size
Performance issues directly impact user engagement and conversion rates.
| URL | Resource Size | Est Savings | |
|---|---|---|---|
article.tna-card > div.tna-card__image-container > picture.tna-card__image > img article.tna-card > div.tna-card__image-container > picture.tna-card__image > img | /media/images/Collection_image_E3_iKGMwH6.2e16d0ba.fill-6... | 58.6 KiB | 19.5 KiB |
These insights are also available in the Chrome DevTools Performance Panel - record a trace to view more detailed information.
Redirects introduce additional delays before the page can be loaded. Learn how to avoid page redirects.
Performance issues directly impact user engagement and conversion rates.
| URL | Time Spent |
|---|---|
| nationalarchives.gov.uk/ | 761 ms |
| www.nationalarchives.gov.uk/ | 0.0 ms |
Time to Interactive is the amount of time it takes for the page to become fully interactive. Learn more about the Time to Interactive metric.
Performance issues directly impact user engagement and conversion rates.
Reduce unused rules from stylesheets and defer CSS not used for above-the-fold content to decrease bytes consumed by network activity. Learn how to reduce unused CSS.
Performance issues directly impact user engagement and conversion rates.
| URL | Transfer Size | Est Savings |
|---|---|---|
| www.nationalarchives.gov.uk/static/font-awesome.css?v=26.04.16.1630 | 19.9 KiB | 19.7 KiB |
| www.nationalarchives.gov.uk/static/main.css?v=26.04.16.1630 | 17.9 KiB | 14.8 KiB |
More information about the performance of your application. These numbers don't directly affect the Performance score.
These checks highlight opportunities to improve the accessibility of your web app. Automatic detection can only detect a subset of issues and does not guarantee the accessibility of your web app, so manual testing is also encouraged.
Visible text labels that do not match the accessible name can result in a confusing experience for screen reader users. Learn more about accessible names.
Performance issues directly impact user engagement and conversion rates.
| Failing Elements |
|---|
X (formerly Twitter) nav.tna-footer__social > ul.tna-ul > li.tna-footer__social-item > a.tna-footer__social-item-link |
These checks ensure that your page is following basic search engine optimization advice. There are many additional factors Lighthouse does not score here that may affect your search ranking, including performance on Core Web Vitals. Learn more about Google Search Essentials.
Industry-standard audits powered by Google Lighthouse. — Desktop
Key metrics that affect user experience. — Desktop
First Contentful Paint First Contentful Paint — how long until the browser renders the first piece of content. Under 1.8s is good.
1.05 s
Largest Contentful Paint Largest Contentful Paint — how long until the largest visible element loads. Under 2.5s is good.
1.11 s
Total Blocking Time Total Blocking Time — total time the main thread was blocked, preventing user input. Under 200ms is good.
0 ms
Cumulative Layout Shift Cumulative Layout Shift — measures visual stability. How much the page layout shifts during loading. Under 0.1 is good.
0.205
Speed Index Speed Index — how quickly content is visually displayed during load. Under 3.4s is good.
1.05 s
Time to Interactive Time to Interactive — how long until the page is fully interactive and responds to user input. Under 3.8s is good.
1.11 s
Audit breakdown by category with detailed findings.
Remove large, duplicate JavaScript modules from bundles to reduce unnecessary bytes consumed by network activity.
Performance issues directly impact user engagement and conversion rates.
Polyfills and transforms enable older browsers to use new JavaScript features. However, many aren't necessary for modern browsers. Consider modifying your JavaScript build process to not transpile Baseline features, unless you know you must support older browsers. Learn why most sites can deploy ES6+ code without transpiling
Shipping ES5 transpiled code to modern browsers wastes bytes — every user with an evergreen browser pays for compatibility you don't need.
Most users today run browsers that natively support ES6+, async/await, optional chaining, and the rest of modern JavaScript. Transpiling to ES5 'just in case' adds 20-40% to your bundle for no benefit. Configure your build to target a modern browserslist, or ship a differential bundle pair (modern + legacy) with the module/nomodule pattern.
Source: Google web.dev / Lighthouse
3rd party code can significantly impact load performance. Reduce and defer loading of 3rd party code to prioritize your page's content.
Performance issues directly impact user engagement and conversion rates.
Layout shifts occur when elements move absent any user interaction. Investigate the causes of layout shifts, such as elements being added, removed, or their fonts changing as the page loads.
Performance issues directly impact user engagement and conversion rates.
Your first network request is the most important. Reduce its latency by avoiding redirects, ensuring a fast server response, and enabling text compression.
Performance issues directly impact user engagement and conversion rates.
HTTP/2 and HTTP/3 offer many benefits over HTTP/1.1, such as multiplexing. Learn more about using modern HTTP.
Performance issues directly impact user engagement and conversion rates.
Avoid chaining critical requests by reducing the length of chains, reducing the download size of resources, or deferring the download of unnecessary resources to improve page load.
Performance issues directly impact user engagement and conversion rates.
Requests are blocking the page's initial render, which may delay LCP. Deferring or inlining can move these network requests out of the critical path.
Performance issues directly impact user engagement and conversion rates.
| URL | Transfer Size | Duration |
|---|---|---|
| /css2?family=Open+Sans:wght@400..700&family=Roboto+Mono:w... | 2.1 KiB | 237 ms |
| use.typekit.net/kaq6qqh.css | 854 B | 208 ms |
| www.nationalarchives.gov.uk/static/homepage.css?v=26.04.16.1630 | 2.2 KiB | 130 ms |
| www.nationalarchives.gov.uk/static/font-awesome.css?v=26.04.16.1630 | 22.0 KiB | 212 ms |
| www.nationalarchives.gov.uk/static/main.css?v=26.04.16.1630 | 20.0 KiB | 130 ms |
| p.typekit.net/p.css?s=1&k=kaq6qqh&ht=tk&f=17141&a=157040217&app=typekit&e=css | 173 B | 204 ms |
A long cache lifetime can speed up repeat visits to your page. Learn more about caching.
Performance issues directly impact user engagement and conversion rates.
| Request | Cache TTL | Transfer Size |
|---|---|---|
| p.typekit.net/p.css?s=1&k=kaq6qqh&ht=tk&f=17141&a=157040217&app=typekit&e=css | 604800.0 s | 173 B |
Consider setting font-display to swap or optional to ensure text is consistently visible. swap can be further optimized to mitigate layout shifts with font metric overrides.
Performance issues directly impact user engagement and conversion rates.
| URL | Est Savings |
|---|---|
| www.nationalarchives.gov.uk/static/assets/fonts/fa-solid-900.woff2 | 5.0 ms |
Reducing the download time of images can improve the perceived load time of the page and LCP. Learn more about optimizing image size
Performance issues directly impact user engagement and conversion rates.
| URL | Resource Size | Est Savings | |
|---|---|---|---|
article.tna-card > div.tna-card__image-container > picture.tna-card__image > img article.tna-card > div.tna-card__image-container > picture.tna-card__image > img | /media/images/Collection_image_E3_iKGMwH6.2e16d0ba.fill-6... | 58.6 KiB | 42.6 KiB |
A printed copy of a dense piece of text that fills the page. At the top the wor… article.tna-card > div.tna-card__image-container > picture.tna-card__image > img | /media/images/hg-us-declaration-indepe.6b5ea91c.fill-600x... | 52.0 KiB | 36.0 KiB |
Rows of neatly stacked archival boxes. article.tna-card > div.tna-card__image-container > picture.tna-card__image > img | /media/images/The_National_Archiv_GNi1HG1.2e16d0ba.fill-6... | 36.4 KiB | 21.5 KiB |
Four visitors sit at tables in a large, open room. Each is looking at a documen… article.tna-card > div.tna-card__image-container > picture.tna-card__image > img | /media/images/researching-in-docu_cmfInz2.6f6e9d24.fill-6... | 26.7 KiB | 15.8 KiB |
article.tna-card > div.tna-card__image-container > picture.tna-card__image > img article.tna-card > div.tna-card__image-container > picture.tna-card__image > img | /media/images/On_the_Record_VE_Day.90141c71.fill-600x400.... | 25.4 KiB | 15.0 KiB |
These insights are also available in the Chrome DevTools Performance Panel - record a trace to view more detailed information.
Reduce unused rules from stylesheets and defer CSS not used for above-the-fold content to decrease bytes consumed by network activity. Learn how to reduce unused CSS.
Performance issues directly impact user engagement and conversion rates.
| URL | Transfer Size | Est Savings |
|---|---|---|
| www.nationalarchives.gov.uk/static/font-awesome.css?v=26.04.16.1630 | 19.9 KiB | 19.7 KiB |
| www.nationalarchives.gov.uk/static/main.css?v=26.04.16.1630 | 17.9 KiB | 14.9 KiB |
More information about the performance of your application. These numbers don't directly affect the Performance score.
Redirects introduce additional delays before the page can be loaded. Learn how to avoid page redirects.
Performance issues directly impact user engagement and conversion rates.
| URL | Time Spent |
|---|---|
| nationalarchives.gov.uk/ | 208 ms |
| www.nationalarchives.gov.uk/ | 0.0 ms |
These are the largest layout shifts observed on the page. Each table item represents a single layout shift, and shows the element that shifted the most. Below each item are possible root causes that led to the layout shift. Some of these layout shifts may not be included in the CLS metric value due to windowing. Learn how to improve CLS
Performance issues directly impact user engagement and conversion rates.
| Element | Layout shift score |
|---|---|
The National Archives
Explore 1,000 years of history
Help with your research
… body.tna-template__body > main#main-content | 0.202 |
Visit
What’s on
Explore the collection
Help using the archive
Education
Profess… body.tna-template__body > header.tna-global-header > div.tna-container > nav#tna-header__navigation | 0.003 |
These checks highlight opportunities to improve the accessibility of your web app. Automatic detection can only detect a subset of issues and does not guarantee the accessibility of your web app, so manual testing is also encouraged.
Visible text labels that do not match the accessible name can result in a confusing experience for screen reader users. Learn more about accessible names.
Performance issues directly impact user engagement and conversion rates.
| Failing Elements |
|---|
X (formerly Twitter) nav.tna-footer__social > ul.tna-ul > li.tna-footer__social-item > a.tna-footer__social-item-link |
These checks ensure that your page is following basic search engine optimization advice. There are many additional factors Lighthouse does not score here that may affect your search ranking, including performance on Core Web Vitals. Learn more about Google Search Essentials.
Send Feedback