Audit overview
3 categories need attention: Security, and 2 others.
Fix Priority Matrix
5 findingsQuick Wins
2High impact, low effort — start here.
Strategic
3High impact, requires investment.
Easy Improvements
0Small gains, minimal effort.
Nothing in this quadrant — good news.
Deprioritize
0Low impact, high effort — do last.
Nothing in this quadrant — good news.
Screenshots

Top Priorities (5)
Content-Security-Policy header is missing
Without a CSP, a single XSS bug can exfiltrate everything your users type — including credentials.
No Content-Security-Policy header found
Without a CSP, a single XSS bug can exfiltrate everything users type — credentials, payment data, session tokens.
Page weighs 15.7 MB (7.4 MB transferred)
Informational: total page weight (uncompressed) and bytes actually transferred over the wire.
18 control(s) without accessible label
Form controls without labels — assistive tech announces 'edit text' with no context; users can't complete forms.
2 button(s) with no accessible text
Buttons with no accessible text (icon-only, no aria-label) can't be activated by voice control or understood by screen readers.
Business case
What fixing the audit's findings is worth -- and what ignoring them keeps costing.
Return on investment
€413 investment → €3,461/month returns + EUR 120,500,000 risk avoided
Figures combine localized regulatory fine ceilings, search/conversion value priced against local CPC, and bandwidth waste estimates. Results depend on implementation quality and audience composition. Not legal or financial advice.
Conversion barriers
7 barrier(s) likely increasing bounce by ~32%.
- Page takes 17.7s to loadUsers abandon at ~3s — you're 15.2s over the 2.5s threshold→ Optimize render-blocking resources, preload the hero image, and compress images
- Page feels frozen for 3.9sClicks on the primary CTA are ignored while JavaScript runs→ Break up long tasks; defer non-critical JavaScript to post-hydration
- 18 form field(s) without a labelScreen readers skip unlabeled fields; autofill can't identify them; checkout abandonment spikes→ Associate every input with a visible <label for="…">; add autocomplete attributes
- 4 broken link(s) on the pageClicks land on 404s — trust drops and the session often ends→ Fix or remove the broken destinations surfaced on the Content tab
- No HSTS headerReturning visitors are briefly exposed to downgrade attacks on first request→ Set Strict-Transport-Security: max-age=31536000; includeSubDomains
Preliminary CRO audit — each barrier links to the tab with detailed analysis.
Remediation cost
Start here for the best return on investment
Cost by category
Cost by effort level
Adjust assumptions
Team composition
Multiplier applied to dev hours to reflect QA, design, and PM overhead. Use Dev only for solo work; Full team for projects with formal review processes.
Rates reflect fully-loaded developer cost including overhead
Warning:Cost of inaction
Compliance Risk
€120.500.000
- No privacy policy link detectedRGPD: EUR 10.000 – EUR 20.000.000
- Trackers detected but no cookie policy foundRGPD: EUR 5.000 – EUR 10.000.000
- Trackers detected but no cookie policy foundRGPD: EUR 10.000 – EUR 20.000.000
Bounce-Rate Cost
€3.459 /mo
+32.2pp bounce · ~3,221 lost visitors/mo
CPC: EUR 1.07
Bandwidth Waste
€1,73 /mo
23386.3 MB/mo × 0.074 EUR/GB
- Optimize transfer: save ~2.3 MB per page loadSaves €1,73/mo
Compliance figures represent the statutory maximum fine for the most severe triggered category, capped per regulation — not the sum of per-finding penalties. Based on published regulatory fine ranges. This is not legal advice.
Unique monthly visitors from your analytics
Purchases, signups, or key actions
Optional — for revenue estimation
more engaged visitors from reduced bounce
Fix 5 critical issues to capture this value
How this is calculated
Based on Google/Deloitte research ("Milliseconds Make Millions") showing a ~7% bounce rate increase per additional second of LCP above the 2.5s "Good" threshold.
Your site's LCP: → estimated after fixes.
These are estimates based on industry research — actual results vary
Your data stays in your browser — nothing is sent to our servers
Lighthouse
Mobile
First Contentful Paint First Contentful Paint — how long until the browser renders the first piece of content. Under 1.8s is good.
10.12 s
Largest Contentful Paint Largest Contentful Paint — how long until the largest visible element loads. Under 2.5s is good.
17.67 s
Total Blocking Time Total Blocking Time — total time the main thread was blocked, preventing user input. Under 200ms is good.
3.86 s
Cumulative Layout Shift Cumulative Layout Shift — measures visual stability. How much the page layout shifts during loading. Under 0.1 is good.
0.000
Speed Index Speed Index — how quickly content is visually displayed during load. Under 3.4s is good.
11.47 s
Time to Interactive Time to Interactive — how long until the page is fully interactive and responds to user input. Under 3.8s is good.
24.31 s
Desktop
First Contentful Paint First Contentful Paint — how long until the browser renders the first piece of content. Under 1.8s is good.
1.30 s
Largest Contentful Paint Largest Contentful Paint — how long until the largest visible element loads. Under 2.5s is good.
2.90 s
Total Blocking Time Total Blocking Time — total time the main thread was blocked, preventing user input. Under 200ms is good.
270 ms
Cumulative Layout Shift Cumulative Layout Shift — measures visual stability. How much the page layout shifts during loading. Under 0.1 is good.
0.416
Speed Index Speed Index — how quickly content is visually displayed during load. Under 3.4s is good.
3.34 s
Time to Interactive Time to Interactive — how long until the page is fully interactive and responds to user input. Under 3.8s is good.
4.32 s
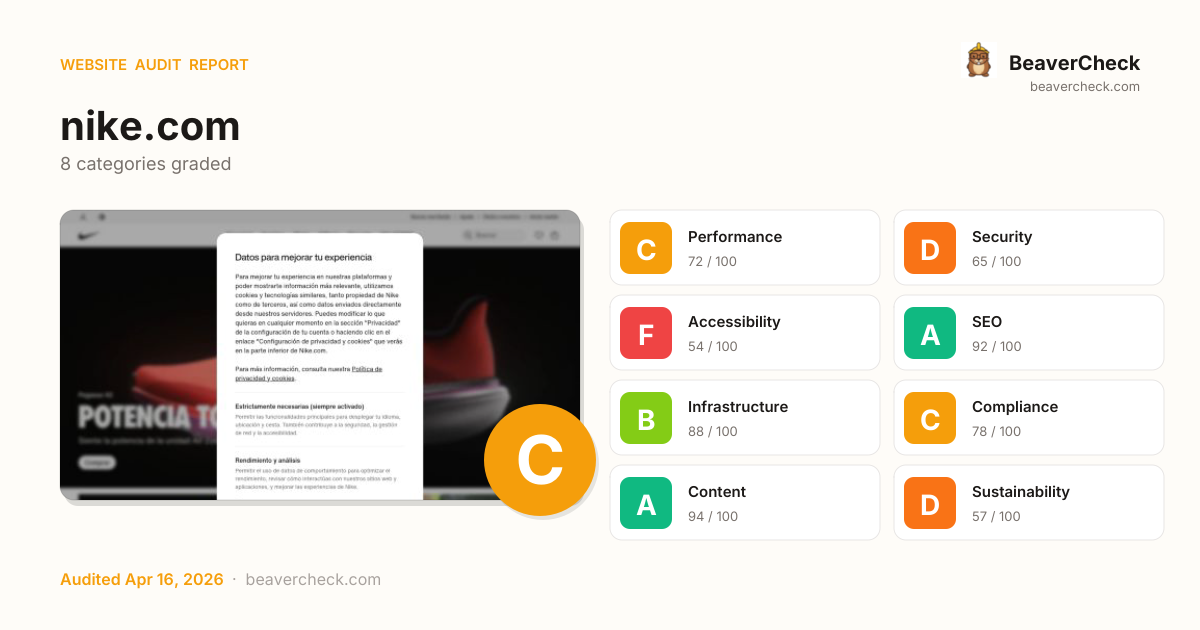
Categories
8Performance
Page weighs 15.7 MB (7.4 MB transferred)
Security
Content-Security-Policy header is missing
Accessibility
18 control(s) without accessible label
SEO
All checks pass
Infrastructure
All checks pass
Compliance
All checks pass
Content
All checks pass
Sustainability
All checks pass
How you compare
Where this site stands against peers running the same stack.
Top 10% of Cart Functionality sites score 86+ on Sustainability; you're at 57 — closing this gap is the highest-leverage improvement.
Top 10% of Apple sites score 86+ on Sustainability; you're at 57 — closing this gap is the highest-leverage improvement.
Technology stack
Apple, on Emotion, hosted on AWS, with AWS CloudFront CDN
Stack Architecture
 Akamai mPulse
  New Relic
  Cart Functionality
  Boomerang
  Bootstrap Facebook Google Search Console HSTS
  Kasada Microsoft
  Open Graph Proofpoint
  React 18.3.1
 SheerID
  Underscore.js 4.17.21
 VideoJS
  Webpack
  core-js 2.6.12
 Emotion
  AWS CloudFront Amazon CloudFront
  Cloudflare
  cdnjs
cdnjs  AWS Amazon Web Services
  Next.js 15.5.11
All Detected Technologies (27)
Amazon CloudFront is a fast content delivery network (CDN) service that securely delivers data, videos, applications, and APIs to customers globally with low latency, high transfer speeds.
Cloudflare is a web-infrastructure and website-security company, providing content-delivery-network services, DDoS mitigation, Internet security, and distributed domain-name-server services.
cdnjs is a free distributed JS library delivery service.
Amazon Web Services (AWS) is a comprehensive cloud services platform offering compute power, database storage, content delivery and other functionality.
Next.js is a React framework for developing single page Javascript applications.
Emotion is a library designed for writing CSS styles with JavaScript.
Websites that have a shopping cart or checkout page, either using a known ecommerce platform or a custom solution.
boomerang is a JavaScript library that measures the page load time experienced by real users, commonly called RUM (Real User Measurement).
HTTP Strict Transport Security (HSTS) informs browsers that the site should only be accessed using HTTPS.
Kasada is a cybersecurity company that provides a platform to protect websites and web applications from bot attacks and malicious activities.
Open Graph is a protocol that is used to integrate any web page into the social graph.
React is an open-source JavaScript library for building user interfaces or UI components.
SheerID is a highly specialised solution offering online verification support for retailers, marketers and service providers.
Underscore.js is a JavaScript library which provides utility functions for common programming tasks. It is comparable to features provided by Prototype.js and the Ruby language, but opts for a functional programming design instead of extending object prototypes.
Video.js is a JavaScript and CSS library that makes it easier to work with and build on HTML5 video.
Webpack is an open-source JavaScript module bundler.
core-js is a modular standard library for JavaScript, with polyfills for cutting-edge ECMAScript features.
Akamai mPulse is a real user monitoring (RUM) solution that enables companies to monitor, find, and fix website and application performance issues.
New Relic is a SaaS offering that focuses on performance and availability monitoring.
Observations (2)
No build tool detected
A framework (Apple) was detected but no bundler was identified. The build tool may not be detectable from output patterns, or the site may use the framework's built-in bundler.
Complex technology stack detected
27 technologies identified. A complex stack increases maintenance burden and attack surface. Consider whether all components are actively needed.
Show your score
Drop this badge on your README, marketing site, or status page. It auto-updates every time the audit re-runs and links back to this report.
This badge auto-updates with your latest scan result.
[](https://beavercheck.com/sites/nike.com)<a href="https://beavercheck.com/sites/nike.com"><img src="https://beavercheck.com/badge?url=https%3A%2F%2Fnike.com" alt="BeaverCheck Score"></a>https://beavercheck.com/badge?url=https%3A%2F%2Fnike.comExport & share
Download the audit, share with your team, or grab a fix plan ready to copy into your tracker.
Copies markdown to clipboard
Fix Plan
Three-week roadmap to ship the audit's findings, with one-click copy targets for your tracker.
Three-week fix plan
2 sprints · 8h total → projected B (83)
Sprint 1: Quick Wins
+4Highest ROI — low effort, high impact
- · Page weighs 15.7 MB (7.4 MB transferred)
- · 2 button(s) with no accessible text
Sprint 2: Core Fixes
+7Medium effort, high structural impact
- · 18 control(s) without accessible label
- · Content-Security-Policy header is missing
- · No Content-Security-Policy header found