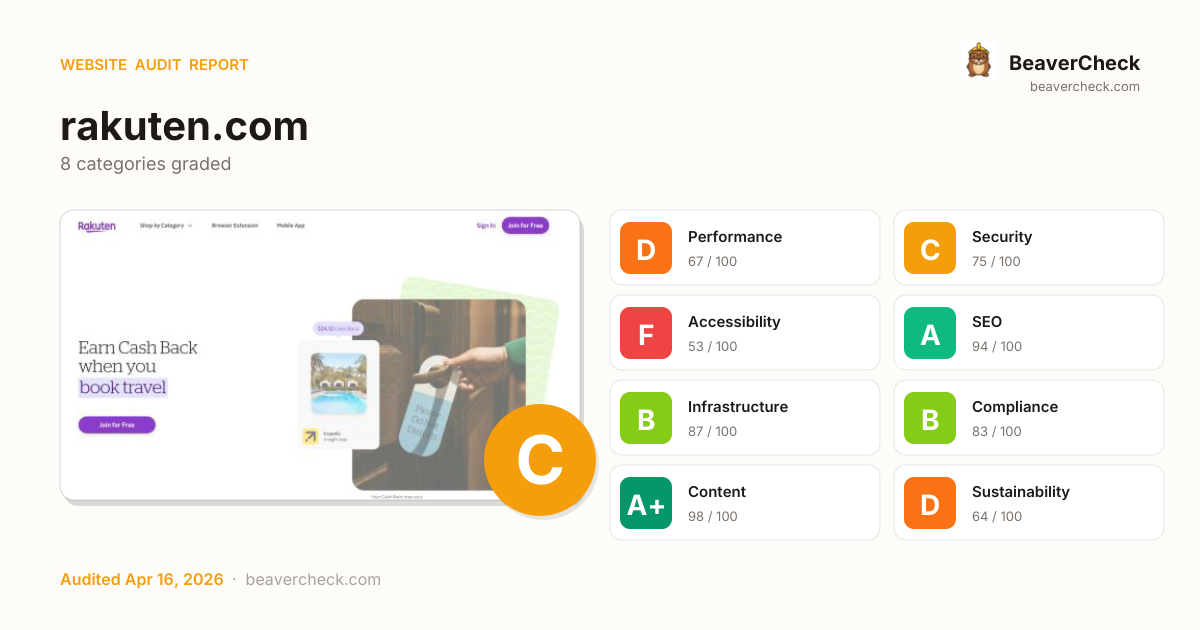
Mobile 375 × 812

Desktop 1440 × 900

Score: 74 / 100
Based on 8 categories, 0 sections
Room to improve — your 13.8s load time is above Google's 2.5s 'Good' threshold.
Good foundation, but a few gaps could be exploited.
Several issues make your site difficult for assistive technology users.
Well-optimized for search — your content is discoverable.
Solid infrastructure — fast server responses across the board.
Mostly compliant — a few items need attention.
Rich content metadata — your pages look great everywhere.
Heavier than average — reducing page weight saves energy and bandwidth.
The overall score is a weighted average of individual category scores. Categories with more impact on user experience and security carry more weight.
Weights reflect general web best practices. Individual needs may differ.
Page weighs 15.0 MB (4.6 MB transferred)
Performance issues directly impact user engagement and conversion rates.
4 image(s) missing alt attribute
Accessibility issues exclude users with disabilities — up to 15% of your potential audience.
No <main> landmark found
Accessibility issues exclude users with disabilities — up to 15% of your potential audience.
281 third-party resources (100% of weight)
Performance issues directly impact user engagement and conversion rates.
282 HTTP requests — consider bundling or reducing
Performance issues directly impact user engagement and conversion rates.
High impact, low effort — start here.
Nothing in this quadrant — good news.
High impact, requires investment.
Small gains, minimal effort.
Nothing in this quadrant — good news.
Low impact, high effort — do last.
Nothing in this quadrant — good news.
[](https://beavercheck.com/results/3d52f91f-9574-4772-9cc8-6e5be5999077)<a href="https://beavercheck.com/results/3d52f91f-9574-4772-9cc8-6e5be5999077"><img src="https://beavercheck.com/badge?url=https%3A%2F%2Frakuten.com" alt="BeaverCheck Score"></a>https://beavercheck.com/badge?url=https%3A%2F%2Frakuten.comThis badge auto-updates with your latest scan result.
Your site performs reasonably well, but a few targeted fixes could meaningfully improve results. Your LCP of 13.8s exceeds Google's 2.5s 'Good' threshold and the 3 performance issues below directly contribute to it. Accessibility issues exclude users who rely on assistive technology — an estimated 15% of your potential audience. Addressing the critical issues below would have the most immediate impact on your conversion rate.
7 barrier(s) likely increasing bounce by ~30%.
Page takes 13.8s to load
+12% bounceUsers abandon at ~3s — you're 11.3s over the 2.5s threshold
Fix: Optimize render-blocking resources, preload the hero image, and compress images
Page feels frozen for 7.4s
+5% bounceClicks on the primary CTA are ignored while JavaScript runs
Fix: Break up long tasks; defer non-critical JavaScript to post-hydration
No Content-Security-Policy header
+1% bounceHigher XSS blast radius — one compromised script can exfiltrate the checkout form
Fix: Ship a reporting-only CSP first, then enforce once violations are clean
Layout shifts during page load
+3% bounceContent movement causes mis-clicks on CTAs and form fields
Fix: Add width/height to images; reserve space for late-loading embeds
Viewport disables user zoom
+2% bounceVisitors with low vision can't read the page — and some jurisdictions treat this as a legal risk
Fix: Remove user-scalable=no; drop maximum-scale if it's below 2
No skip-to-content link
+1% bounceKeyboard and screen-reader users must tab through the entire header on every page
Fix: Add a visible-on-focus <a href="#main">Skip to content</a> as the first focusable element
2 broken link(s) on the page
+3% bounceClicks land on 404s — trust drops and the session often ends
Fix: Fix or remove the broken destinations surfaced on the Content tab
Preliminary CRO audit — each barrier links to the tab with detailed analysis.
¥72,000 investment → ¥79,222/month returns
¥72,000
9h · 5 findings
¥79,222 /mo
~¥950,667 / year
No applicable regulations in this jurisdiction
Figures combine localized regulatory fine ceilings, search/conversion value priced against local CPC, and bandwidth waste estimates. Results depend on implementation quality and audience composition. Not legal or financial advice.
9.0 developer hours at ¥8000/hr
Based on Japan rates (¥8000/hr)
¥173 / month at risk
~¥2,081 / year if left unfixed
¥173 /mo
14524.1 MB/mo × 11.940 JPY/GB
Compliance figures represent the statutory maximum fine for the most severe triggered category, capped per regulation — not the sum of per-finding penalties. Based on published regulatory fine ranges. This is not legal advice.
Unique monthly visitors from your analytics
Purchases, signups, or key actions
Optional — for revenue estimation
more engaged visitors from reduced bounce
Fix 3 critical issues to capture this value
Based on Google/Deloitte research ("Milliseconds Make Millions") showing a ~7% bounce rate increase per additional second of LCP above the 2.5s "Good" threshold.
Your site's LCP: → estimated after fixes.
These are estimates based on industry research — actual results vary
Your data stays in your browser — nothing is sent to our servers
Thanks for your feedback!
We'll use a cached audit if available, or offer to scan.
Industry-standard audits powered by Google Lighthouse.
Key metrics that affect user experience.
First Contentful Paint First Contentful Paint — how long until the browser renders the first piece of content. Under 1.8s is good.
6.87 s
Largest Contentful Paint Largest Contentful Paint — how long until the largest visible element loads. Under 2.5s is good.
13.75 s
Total Blocking Time Total Blocking Time — total time the main thread was blocked, preventing user input. Under 200ms is good.
7.39 s
Cumulative Layout Shift Cumulative Layout Shift — measures visual stability. How much the page layout shifts during loading. Under 0.1 is good.
0.191
Speed Index Speed Index — how quickly content is visually displayed during load. Under 3.4s is good.
17.88 s
Time to Interactive Time to Interactive — how long until the page is fully interactive and responds to user input. Under 3.8s is good.
32.82 s
Audit breakdown by category with detailed findings.
Remove large, duplicate JavaScript modules from bundles to reduce unnecessary bytes consumed by network activity.
Performance issues directly impact user engagement and conversion rates.
Polyfills and transforms enable older browsers to use new JavaScript features. However, many aren't necessary for modern browsers. Consider modifying your JavaScript build process to not transpile Baseline features, unless you know you must support older browsers. Learn why most sites can deploy ES6+ code without transpiling
Shipping ES5 transpiled code to modern browsers wastes bytes — every user with an evergreen browser pays for compatibility you don't need.
Most users today run browsers that natively support ES6+, async/await, optional chaining, and the rest of modern JavaScript. Transpiling to ES5 'just in case' adds 20-40% to your bundle for no benefit. Configure your build to target a modern browserslist, or ship a differential bundle pair (modern + legacy) with the module/nomodule pattern.
Source: Google web.dev / Lighthouse
3rd party code can significantly impact load performance. Reduce and defer loading of 3rd party code to prioritize your page's content.
Performance issues directly impact user engagement and conversion rates.
A long cache lifetime can speed up repeat visits to your page. Learn more about caching.
Performance issues directly impact user engagement and conversion rates.
Layout shifts occur when elements move absent any user interaction. Investigate the causes of layout shifts, such as elements being added, removed, or their fonts changing as the page loads.
Performance issues directly impact user engagement and conversion rates.
Your first network request is the most important. Reduce its latency by avoiding redirects, ensuring a fast server response, and enabling text compression.
Performance issues directly impact user engagement and conversion rates.
A forced reflow occurs when JavaScript queries geometric properties (such as offsetWidth) after styles have been invalidated by a change to the DOM state. This can result in poor performance. Learn more about forced reflows and possible mitigations.
Performance issues directly impact user engagement and conversion rates.
Reducing the download time of images can improve the perceived load time of the page and LCP. Learn more about optimizing image size
Performance issues directly impact user engagement and conversion rates.
| URL | Resource Size | Est Savings | |
|---|---|---|---|
Save with Rakuten coupons and Cash Back div.css-0 > div.css-myufwv > img.chakra-image | /img/media/dls/override/1771895466343/lifestyle-image-din... | 67.8 KiB | 62.3 KiB |
Save with Rakuten coupons and Cash Back div.css-0 > div.css-myufwv > img.chakra-image | /img/media/dls/override/1771895135948/lifestyle-image-onl... | 57.2 KiB | 52.5 KiB |
Save with Rakuten coupons and Cash Back div.css-0 > div.css-myufwv > img.chakra-image | /img/media/dls/override/1771895987718/lifestyle-image-ins... | 42.4 KiB | 39.0 KiB |
Save with Rakuten coupons and Cash Back div.css-0 > div.css-myufwv > img.chakra-image | static.rakuten.com/img/media/dls/override/1771895745288/lifestyle-image.jpg | 41.3 KiB | 37.9 KiB |
Save with Rakuten coupons and Cash Back div.css-0 > div.css-4se6yj > img.chakra-image | static.rakuten.com/img/media/dls/override/1771895747294/product-image-travel.jpg | 19.4 KiB | 18.2 KiB |
Save with Rakuten coupons and Cash Back div.css-0 > div.css-4se6yj > img.chakra-image | /img/media/dls/override/1771895989708/product-image-insto... | 12.8 KiB | 12.0 KiB |
Save with Rakuten coupons and Cash Back div.css-0 > div.css-4se6yj > img.chakra-image | static.rakuten.com/img/media/dls/override/1771895468393/product-image-dining.jpg | 12.4 KiB | 11.7 KiB |
Save with Rakuten coupons and Cash Back div.css-0 > div.css-4se6yj > img.chakra-image | static.rakuten.com/img/media/dls/override/1771895137952/product-image-online.jpg | 9.9 KiB | 9.3 KiB |
App Store div.css-19e7tyi > div.css-16q3jpk > div.css-1mmlg0j > img.chakra-image | static.rakuten.com/img/media/dls/override/1771895129920/icon-appstore.png | 7.3 KiB | 7.2 KiB |
Optimize LCP by making the LCP image discoverable from the HTML immediately, and avoiding lazy-loading
Performance issues directly impact user engagement and conversion rates.
Avoid chaining critical requests by reducing the length of chains, reducing the download size of resources, or deferring the download of unnecessary resources to improve page load.
Performance issues directly impact user engagement and conversion rates.
These insights are also available in the Chrome DevTools Performance Panel - record a trace to view more detailed information.
Time to Interactive is the amount of time it takes for the page to become fully interactive. Learn more about the Time to Interactive metric.
Performance issues directly impact user engagement and conversion rates.
The maximum potential First Input Delay that your users could experience is the duration of the longest task. Learn more about the Maximum Potential First Input Delay metric.
Performance issues directly impact user engagement and conversion rates.
Redirects introduce additional delays before the page can be loaded. Learn how to avoid page redirects.
Performance issues directly impact user engagement and conversion rates.
| URL | Time Spent |
|---|---|
| rakuten.com/ | 821 ms |
| www.rakuten.com/ | 0.0 ms |
These are the largest layout shifts observed on the page. Each table item represents a single layout shift, and shows the element that shifted the most. Below each item are possible root causes that led to the layout shift. Some of these layout shifts may not be included in the CLS metric value due to windowing. Learn how to improve CLS
Performance issues directly impact user engagement and conversion rates.
| Element | Layout shift score |
|---|---|
| 0.355 | |
body.chakra-ui-light > div.ul-container > iframe#ul-frame body.chakra-ui-light > div.ul-container > iframe#ul-frame | 0.191 |
Join for Free header.css-k008qs > div.css-kictd8 > div.css-84nudp > button#join_for_free_header_button | 0.001 |
| 0.000 |
Reduce unused JavaScript and defer loading scripts until they are required to decrease bytes consumed by network activity. Learn how to reduce unused JavaScript.
Multi-megabyte JavaScript bundles delay every interactive feature on the page.
This is the Lighthouse audit fired when too much JS is shipped relative to what executes. The fix isn't a config flag — it requires bundle analysis (webpack-bundle-analyzer, rollup-plugin-visualizer), splitting routes into chunks, lazy-loading off-screen components, and removing unused dependencies. Fundamentally different from minification: minifying reduces byte count, this reduces what's downloaded at all.
Source: Google web.dev / Lighthouse
Consider reducing the time spent parsing, compiling, and executing JS. You may find delivering smaller JS payloads helps with this. Learn how to reduce Javascript execution time.
Performance issues directly impact user engagement and conversion rates.
Consider reducing the time spent parsing, compiling and executing JS. You may find delivering smaller JS payloads helps with this. Learn how to minimize main-thread work
Performance issues directly impact user engagement and conversion rates.
| Category | Time Spent |
|---|---|
| Script Evaluation | 38.2 s |
| Other | 11.2 s |
| Style & Layout | 3.1 s |
| Rendering | 1.5 s |
| Script Parsing & Compilation | 1.3 s |
| Garbage Collection | 797 ms |
| Parse HTML & CSS | 387 ms |
Many navigations are performed by going back to a previous page, or forwards again. The back/forward cache (bfcache) can speed up these return navigations. Learn more about the bfcache
Performance issues directly impact user engagement and conversion rates.
| Failure reason | Failure type |
|---|---|
| Pages with cache-control:no-store header cannot enter back/forward cache. | Actionable |
| Pages whose main resource has cache-control:no-store cannot enter back/forward cache. | Not actionable |
| Back/forward cache is disabled because some JavaScript network request received resource with Cache-Control: no-store header. | Not actionable |
Minifying JavaScript files can reduce payload sizes and script parse time. Learn how to minify JavaScript.
Performance issues directly impact user engagement and conversion rates.
| URL | Transfer Size | Est Savings |
|---|---|---|
| cdn.sprig.com/dependencies/index-DZhnjzQs-2.43.0.js | 44.2 KiB | 10.7 KiB |
| cdn.sprig.com/dependencies/tui-2.43.0.js | 21.9 KiB | 9.1 KiB |
| intl.rakuten-static.com/b/com/rat/js/rat-main-intl.js | 15.5 KiB | 3.2 KiB |
| /profile/visit/final/js?dtm_token_dc=AQAL1PxFuyNVTgET8EiP... | 13.1 KiB | 3.1 KiB |
| /profile/visit/js/1_0?dtm_cid=84832&dtm_fid=8932&dtm_prom... | 12.7 KiB | 3.0 KiB |
| cdn.sprig.com/dependencies/videoPlayer-BV_qt3AP-2.43.0.js | 16.5 KiB | 2.9 KiB |
Large network payloads cost users real money and are highly correlated with long load times. Learn how to reduce payload sizes.
Performance issues directly impact user engagement and conversion rates.
Set an explicit width and height on image elements to reduce layout shifts and improve CLS. Learn how to set image dimensions
Performance issues directly impact user engagement and conversion rates.
| URL | |
|---|---|
December 2025 div.css-93i20 > a.chakra-link > div.css-mbssy4 > img.chakra-image | static.rakuten.com/assets/ac/_next/static/imgs/blank-1a8815.svg |
May 2025 div.css-93i20 > a.chakra-link > div.css-bco1gb > img.chakra-image | static.rakuten.com/assets/ac/_next/static/imgs/blank-1a8815.svg |
July 2025 div.css-93i20 > a.chakra-link > div.css-bco1gb > img.chakra-image | static.rakuten.com/assets/ac/_next/static/imgs/blank-1a8815.svg |
More information about the performance of your application. These numbers don't directly affect the Performance score.
These checks highlight opportunities to improve the accessibility of your web app. Automatic detection can only detect a subset of issues and does not guarantee the accessibility of your web app, so manual testing is also encouraged.
Low-contrast text is difficult or impossible for many users to read. Link text that is discernible improves the experience for users with low vision. Learn how to make links distinguishable.
Performance issues directly impact user engagement and conversion rates.
| Failing Elements |
|---|
Privacy Policy div#accordion-panel-:r7: > div.css-17j1x9m > span.css-18hadnd > a |
These are opportunities to improve the legibility of your content.
Disabling zooming is problematic for users with low vision who rely on screen magnification to properly see the contents of a web page. Learn more about the viewport meta tag.
Performance issues directly impact user engagement and conversion rates.
| Failing Elements |
|---|
head > meta head > meta |
These items highlight common accessibility best practices.
Deprecated APIs will eventually be removed from the browser. Learn more about deprecated APIs.
Performance issues directly impact user engagement and conversion rates.
| Deprecation / Warning | Source |
|---|---|
| AttributionReporting | |
| SharedStorage | c.amazon-adsystem.com/aat/amzn.js line 1, col 7935 |
Errors logged to the console indicate unresolved problems. They can come from network request failures and other browser concerns. Learn more about this errors in console diagnostic audit
Performance issues directly impact user engagement and conversion rates.
| Source | Description |
|---|---|
[GSI_LOGGER]: FedCM get() rejects with NetworkError: Error retrieving a token. | |
Attestation check for Shared Storage on https://ara.paa-reporting-advertising.amazon failed. | |
Not signed in with the identity provider. |
Source maps translate minified code to the original source code. This helps developers debug in production. In addition, Lighthouse is able to provide further insights. Consider deploying source maps to take advantage of these benefits. Learn more about source maps.
Performance issues directly impact user engagement and conversion rates.
These checks ensure that your page is following basic search engine optimization advice. There are many additional factors Lighthouse does not score here that may affect your search ranking, including performance on Core Web Vitals. Learn more about Google Search Essentials.
Industry-standard audits powered by Google Lighthouse. — Desktop
Key metrics that affect user experience. — Desktop
First Contentful Paint First Contentful Paint — how long until the browser renders the first piece of content. Under 1.8s is good.
959 ms
Largest Contentful Paint Largest Contentful Paint — how long until the largest visible element loads. Under 2.5s is good.
2.61 s
Total Blocking Time Total Blocking Time — total time the main thread was blocked, preventing user input. Under 200ms is good.
971 ms
Cumulative Layout Shift Cumulative Layout Shift — measures visual stability. How much the page layout shifts during loading. Under 0.1 is good.
0.002
Speed Index Speed Index — how quickly content is visually displayed during load. Under 3.4s is good.
11.08 s
Time to Interactive Time to Interactive — how long until the page is fully interactive and responds to user input. Under 3.8s is good.
8.46 s
Audit breakdown by category with detailed findings.
Remove large, duplicate JavaScript modules from bundles to reduce unnecessary bytes consumed by network activity.
Performance issues directly impact user engagement and conversion rates.
Polyfills and transforms enable older browsers to use new JavaScript features. However, many aren't necessary for modern browsers. Consider modifying your JavaScript build process to not transpile Baseline features, unless you know you must support older browsers. Learn why most sites can deploy ES6+ code without transpiling
Shipping ES5 transpiled code to modern browsers wastes bytes — every user with an evergreen browser pays for compatibility you don't need.
Most users today run browsers that natively support ES6+, async/await, optional chaining, and the rest of modern JavaScript. Transpiling to ES5 'just in case' adds 20-40% to your bundle for no benefit. Configure your build to target a modern browserslist, or ship a differential bundle pair (modern + legacy) with the module/nomodule pattern.
Source: Google web.dev / Lighthouse
3rd party code can significantly impact load performance. Reduce and defer loading of 3rd party code to prioritize your page's content.
Performance issues directly impact user engagement and conversion rates.
Your first network request is the most important. Reduce its latency by avoiding redirects, ensuring a fast server response, and enabling text compression.
Performance issues directly impact user engagement and conversion rates.
A forced reflow occurs when JavaScript queries geometric properties (such as offsetWidth) after styles have been invalidated by a change to the DOM state. This can result in poor performance. Learn more about forced reflows and possible mitigations.
Performance issues directly impact user engagement and conversion rates.
Reducing the download time of images can improve the perceived load time of the page and LCP. Learn more about optimizing image size
Performance issues directly impact user engagement and conversion rates.
| URL | Resource Size | Est Savings | |
|---|---|---|---|
Save with Rakuten coupons and Cash Back div.css-0 > div.css-myufwv > img.chakra-image | /img/media/dls/override/1771895466343/lifestyle-image-din... | 67.8 KiB | 52.2 KiB |
Save with Rakuten coupons and Cash Back div.css-0 > div.css-myufwv > img.chakra-image | /img/media/dls/override/1771895135948/lifestyle-image-onl... | 57.2 KiB | 44.0 KiB |
Save with Rakuten coupons and Cash Back div.css-0 > div.css-myufwv > img.chakra-image | /img/media/dls/override/1771895987718/lifestyle-image-ins... | 42.4 KiB | 32.6 KiB |
Save with Rakuten coupons and Cash Back div.css-0 > div.css-myufwv > img.chakra-image | static.rakuten.com/img/media/dls/override/1771895745288/lifestyle-image.jpg | 41.3 KiB | 31.7 KiB |
Save with Rakuten coupons and Cash Back div.css-0 > div.css-4se6yj > img.chakra-image | static.rakuten.com/img/media/dls/override/1771895747294/product-image-travel.jpg | 19.4 KiB | 16.0 KiB |
Save with Rakuten coupons and Cash Back div.css-0 > div.css-4se6yj > img.chakra-image | /img/media/dls/override/1771895989708/product-image-insto... | 12.8 KiB | 10.6 KiB |
Save with Rakuten coupons and Cash Back div.css-0 > div.css-4se6yj > img.chakra-image | static.rakuten.com/img/media/dls/override/1771895468393/product-image-dining.jpg | 12.4 KiB | 10.2 KiB |
Save with Rakuten coupons and Cash Back div.css-0 > div.css-4se6yj > img.chakra-image | static.rakuten.com/img/media/dls/override/1771895137952/product-image-online.jpg | 9.9 KiB | 8.2 KiB |
App Store div.css-19e7tyi > div.css-16q3jpk > div.css-1mmlg0j > img.chakra-image | static.rakuten.com/img/media/dls/override/1771895129920/icon-appstore.png | 7.3 KiB | 7.2 KiB |
Optimize LCP by making the LCP image discoverable from the HTML immediately, and avoiding lazy-loading
Performance issues directly impact user engagement and conversion rates.
Avoid chaining critical requests by reducing the length of chains, reducing the download size of resources, or deferring the download of unnecessary resources to improve page load.
Performance issues directly impact user engagement and conversion rates.
A long cache lifetime can speed up repeat visits to your page. Learn more about caching.
Performance issues directly impact user engagement and conversion rates.
These insights are also available in the Chrome DevTools Performance Panel - record a trace to view more detailed information.
Redirects introduce additional delays before the page can be loaded. Learn how to avoid page redirects.
Performance issues directly impact user engagement and conversion rates.
| URL | Time Spent |
|---|---|
| rakuten.com/ | 270 ms |
| www.rakuten.com/ | 0.0 ms |
Time to Interactive is the amount of time it takes for the page to become fully interactive. Learn more about the Time to Interactive metric.
Performance issues directly impact user engagement and conversion rates.
The maximum potential First Input Delay that your users could experience is the duration of the longest task. Learn more about the Maximum Potential First Input Delay metric.
Performance issues directly impact user engagement and conversion rates.
Reduce unused JavaScript and defer loading scripts until they are required to decrease bytes consumed by network activity. Learn how to reduce unused JavaScript.
Multi-megabyte JavaScript bundles delay every interactive feature on the page.
This is the Lighthouse audit fired when too much JS is shipped relative to what executes. The fix isn't a config flag — it requires bundle analysis (webpack-bundle-analyzer, rollup-plugin-visualizer), splitting routes into chunks, lazy-loading off-screen components, and removing unused dependencies. Fundamentally different from minification: minifying reduces byte count, this reduces what's downloaded at all.
Source: Google web.dev / Lighthouse
Consider reducing the time spent parsing, compiling, and executing JS. You may find delivering smaller JS payloads helps with this. Learn how to reduce Javascript execution time.
Performance issues directly impact user engagement and conversion rates.
Consider reducing the time spent parsing, compiling and executing JS. You may find delivering smaller JS payloads helps with this. Learn how to minimize main-thread work
Performance issues directly impact user engagement and conversion rates.
| Category | Time Spent |
|---|---|
| Script Evaluation | 12.2 s |
| Other | 3.9 s |
| Style & Layout | 1.2 s |
| Rendering | 691 ms |
| Script Parsing & Compilation | 302 ms |
| Garbage Collection | 223 ms |
| Parse HTML & CSS | 126 ms |
Many navigations are performed by going back to a previous page, or forwards again. The back/forward cache (bfcache) can speed up these return navigations. Learn more about the bfcache
Performance issues directly impact user engagement and conversion rates.
| Failure reason | Failure type |
|---|---|
| Pages with cache-control:no-store header cannot enter back/forward cache. | Actionable |
| Pages whose main resource has cache-control:no-store cannot enter back/forward cache. | Not actionable |
| Back/forward cache is disabled because some JavaScript network request received resource with Cache-Control: no-store header. | Not actionable |
Minifying JavaScript files can reduce payload sizes and script parse time. Learn how to minify JavaScript.
Performance issues directly impact user engagement and conversion rates.
| URL | Transfer Size | Est Savings |
|---|---|---|
| intl.rakuten-static.com/b/com/rat/js/rat-main-intl.js | 15.5 KiB | 3.2 KiB |
| /profile/visit/final/js?dtm_token_dc=AQAILV7MnAq69AFsgelg... | 12.9 KiB | 3.0 KiB |
Large network payloads cost users real money and are highly correlated with long load times. Learn how to reduce payload sizes.
Performance issues directly impact user engagement and conversion rates.
Set an explicit width and height on image elements to reduce layout shifts and improve CLS. Learn how to set image dimensions
Performance issues directly impact user engagement and conversion rates.
| URL | |
|---|---|
December 2025 div.css-93i20 > a.chakra-link > div.css-mbssy4 > img.chakra-image | static.rakuten.com/assets/ac/_next/static/imgs/blank-1a8815.svg |
May 2025 div.css-93i20 > a.chakra-link > div.css-bco1gb > img.chakra-image | static.rakuten.com/assets/ac/_next/static/imgs/blank-1a8815.svg |
July 2025 div.css-93i20 > a.chakra-link > div.css-bco1gb > img.chakra-image | static.rakuten.com/assets/ac/_next/static/imgs/blank-1a8815.svg |
More information about the performance of your application. These numbers don't directly affect the Performance score.
These checks highlight opportunities to improve the accessibility of your web app. Automatic detection can only detect a subset of issues and does not guarantee the accessibility of your web app, so manual testing is also encouraged.
Each ARIA `role` supports a specific subset of `aria-*` attributes. Mismatching these invalidates the `aria-*` attributes. Learn how to match ARIA attributes to their roles.
Performance issues directly impact user engagement and conversion rates.
| Failing Elements |
|---|
Shop by Category div.css-14i9dxn > div.css-1o18mby > div.CategoryDropdown > a#CategoryDropdownTrigger |
These are opportunities to improve the usage of ARIA in your application which may enhance the experience for users of assistive technology, like a screen reader.
Low-contrast text is difficult or impossible for many users to read. Link text that is discernible improves the experience for users with low vision. Learn how to make links distinguishable.
Performance issues directly impact user engagement and conversion rates.
| Failing Elements |
|---|
Privacy Policy div#accordion-panel-:Rqlakridmksj6ljkdl5t6: > div.css-17j1x9m > span.css-18hadnd > a |
These are opportunities to improve the legibility of your content.
Disabling zooming is problematic for users with low vision who rely on screen magnification to properly see the contents of a web page. Learn more about the viewport meta tag.
Performance issues directly impact user engagement and conversion rates.
| Failing Elements |
|---|
head > meta head > meta |
One main landmark helps screen reader users navigate a web page. Learn more about landmarks.
Performance issues directly impact user engagement and conversion rates.
| Failing Elements |
|---|
html html |
These items highlight common accessibility best practices.
Deprecated APIs will eventually be removed from the browser. Learn more about deprecated APIs.
Performance issues directly impact user engagement and conversion rates.
| Deprecation / Warning | Source |
|---|---|
| AttributionReporting | connect.facebook.net/en_US/fbevents.js line 279, col 769 |
| SharedStorage | c.amazon-adsystem.com/aat/amzn.js line 1, col 7935 |
Errors logged to the console indicate unresolved problems. They can come from network request failures and other browser concerns. Learn more about this errors in console diagnostic audit
Performance issues directly impact user engagement and conversion rates.
| Source | Description |
|---|---|
[GSI_LOGGER]: FedCM get() rejects with NetworkError: Error retrieving a token. | |
Attestation check for Shared Storage on https://ara.paa-reporting-advertising.amazon failed. | |
Not signed in with the identity provider. |
Source maps translate minified code to the original source code. This helps developers debug in production. In addition, Lighthouse is able to provide further insights. Consider deploying source maps to take advantage of these benefits. Learn more about source maps.
Performance issues directly impact user engagement and conversion rates.
These checks ensure that your page is following basic search engine optimization advice. There are many additional factors Lighthouse does not score here that may affect your search ranking, including performance on Core Web Vitals. Learn more about Google Search Essentials.
Send Feedback